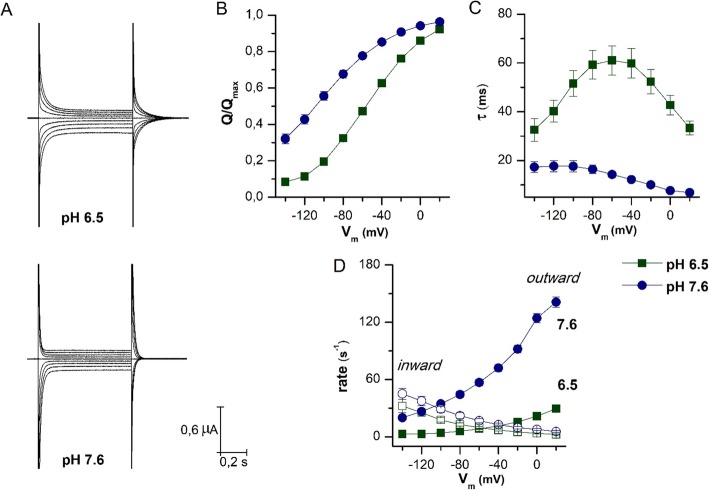
Fig. 5.
Biophysical parameters of PepT1a. a Representative trace of current elicited by voltage pulses in the range − 140 to + 20 mV (20 mV steps from Vh = − 60 mV) in the absence of substrate at pH 6.5 and pH 7.6 as indicated. b–d Analysis of pre-steady-state currents at pH 6.5 (green square) and 7.6 (blue circle) obtained from the slow component of a double exponential fitting of the corresponding traces in the absence of the substrate. b Charge/voltage (Q/V) curves obtained by integration of the pre-steady-state isolated at the two pH values. c Time constant/voltage (τ/V) relation; the values were estimated from the on transients, except at − 60 mV (Vh), which was estimated from the off transients. d Unidirectional rate constants, inward (open symbols) and outward (solid symbols), of the intramembrane charge movement in function of different tested voltage conditions, derived from the τ/V relationship and the Q/V relationship at two pH conditions. Data are mean ± SEM from 10 oocytes of 3 different batches. Vh, holding potential

