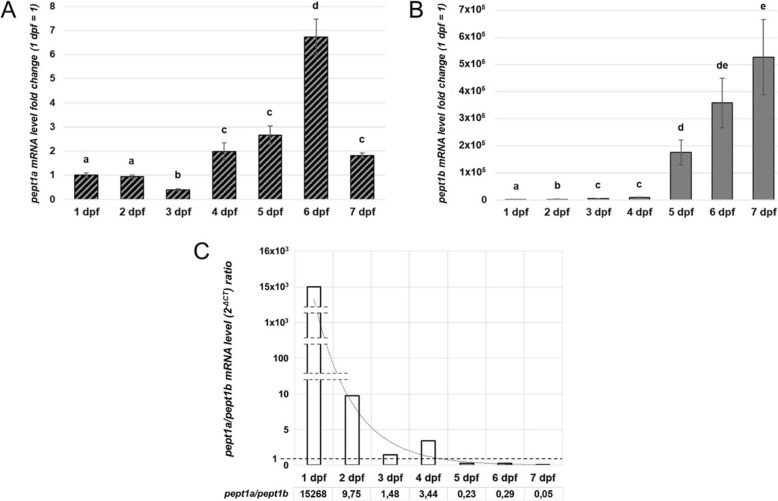
Fig. 7.
Quantitative expression analysis of zebrafish pept1a (slc15a1a) and pept1b (slc15a1b) mRNAs during early development. a mRNA expression analysis by qPCR in zebrafish embryos/larvae from 1 to 7 days post-fertilization (dpf). The levels of pept1a (slc15a1a) mRNA were calculated as 2-ΔCT mean values obtained from two rounds of qPCR assays for each of three independent biological replicates (pools of 10–15 embryos/larvae), and then they were expressed as fold-change (y-axis) with respect to the 1 dpf stage taken as control value (1 dpf = 1). b mRNA expression analysis by qPCR of the pept1b (slc15a1b) gene in zebrafish embryos and larvae from 1 to 7 dpf. Statistical analysis of variance of the means was assessed by one-way ANOVA and Tukey's post hoc test. In histograms, different letters indicate statistically different values (n = 3 independent biological replicates; P < 0.05). c Representation of the trend of the pept1a/pept1b mRNA level ratio at 1 to 7 dpf, based on the 2-ΔCT mean values obtained from the output data deriving from qPCR assays performed, with the same primer efficiency values, for both the pept1a- and pept1b-specific primer pairs

