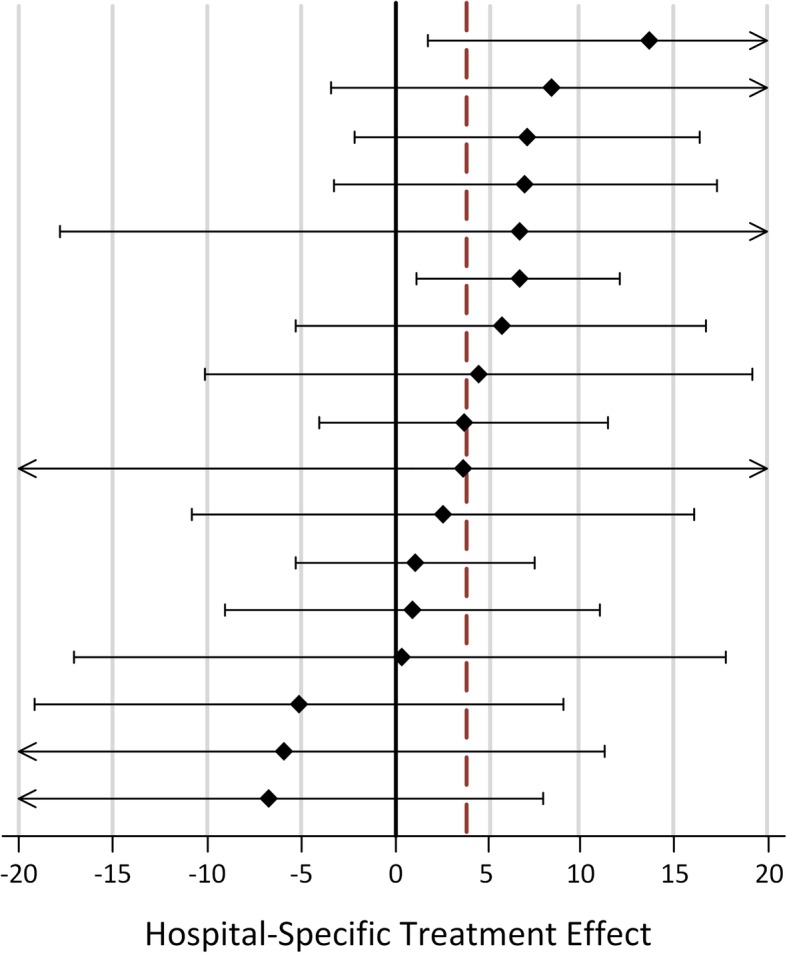
Fig. 5.

Within-Hospital Differences in Stroke Impact Scale (SIS)-16 between Patients Receiving a 14-day Visit. Forest plot of hospital-specific estimates and 95% confidence intervals (CI). Linear mixed models included propensity scores to account for differences in patients receiving the intervention versus not. Dotted line indicates the overall estimate in treated versus non-treated patients. CI values beyond ±20 are indicated with arrows
