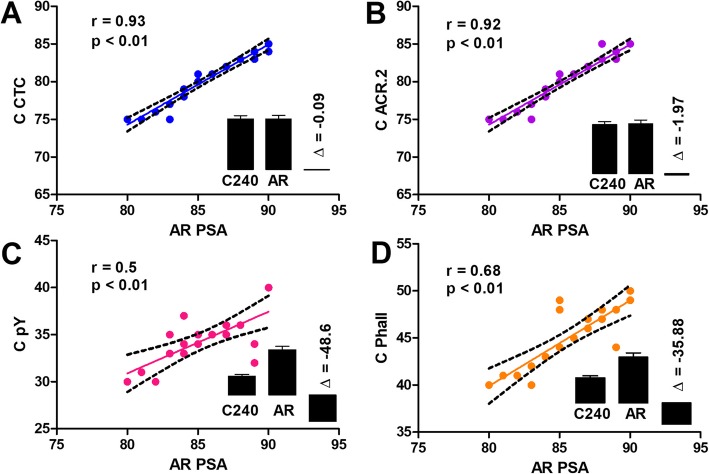
Fig. 4.
Correlations and differences between the % of capacitated boar sperm at 240 min detected by FM by individual methods and % of AR cells detected by PSA FM. Individual graphs show the correlation lines, the correlation coefficient r and its p-value for the CTC (a), ACR.2 (b), pY (c) and FITC-phall (d). The inserted bars represent the comparison of the percentage of cells detected as capacitated by individual methods (C240), the percentage of the cells detected as AR by PSA assay (AR) and their difference (Δ). 20 chilled (17 °C) / diluted boar sperm samples were analyzed for each assay (N = 20)

