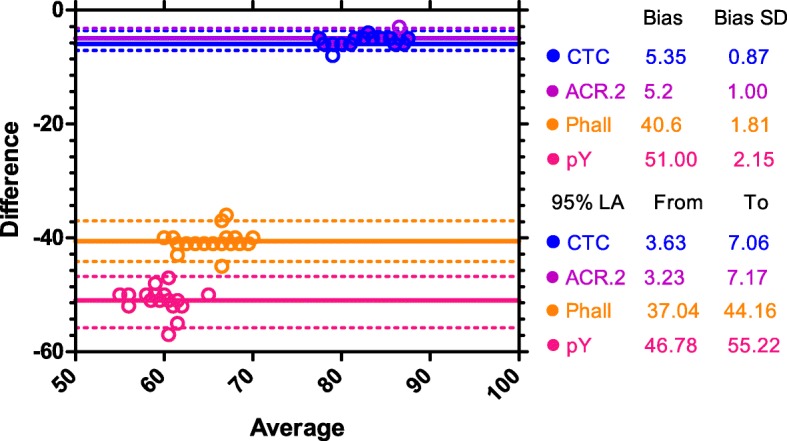
Fig. 5.

Bland-Altman plot. Bland-Altman plot shows the differential bias between the percentage of cells detected as capacitated by individual methods after 240 min of incubation and the percentage of cells detected as acrosome-reacted by PSA after ZP-induced AR. The zero baseline represents the percentage of cells detected as acrosome-reacted by PSA, individual color lines shows the biases for CTC, ACR.2, FITC-phall and pY assays. Circles represents individual data points (N = 20 for each method), dotted lines represent 95% LA (Limits of agreement)
