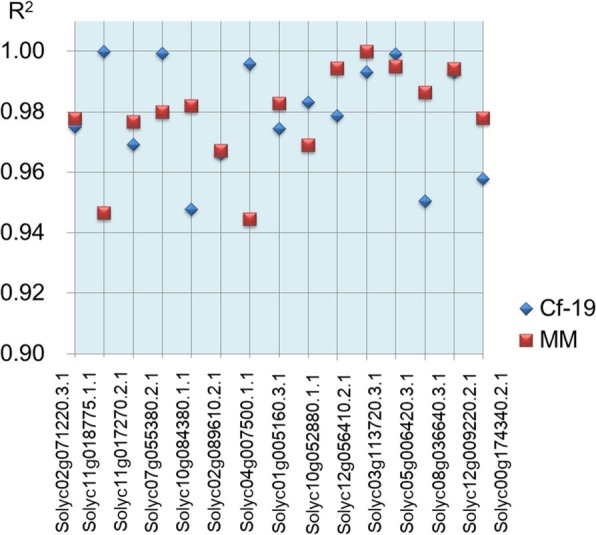
Fig. 3.

Correlation coefficients between the RNA-seq and qRT-PCR results. The expression patterns for both Cf-19 (0, 7 and 20 dai) and MM (0, 7 and 20 dai) were analysed for each gene. The results obtained from both methods (RNA-seq and qRT-PCR analysis) were used to calculate correlation coefficients (R2 values). Each point in the figure represents an “R2” value. MM: Moneymaker; Cf-19: CGN18423
