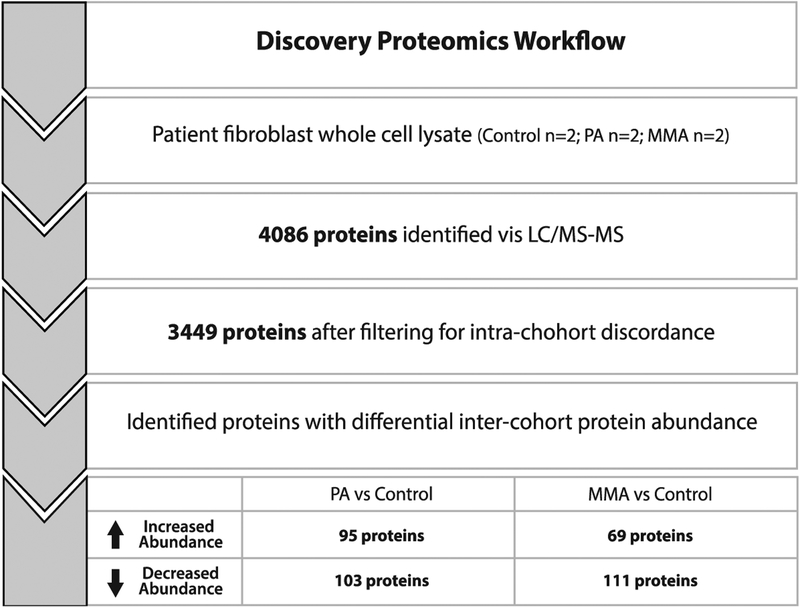
Figure 1.
Workflow for proteomics analysis. A total of 4,086 proteins were identified across the MMA (n=2), PA (n=2) and WT (n=2) fibroblast cohorts. We removed all proteins that fell beyond 2 standard deviations of the mean protein abundance for each matched pair from further analysis. After this exclusion, 3,449 proteins were considered for further analysis to determine differentially expressed proteins between cases and controls. Proteins with abundances that that fell above +2 or below −2 standard deviations when comparing PA/Control and MMA/Control were then considered for functional analysis. MMA, methylmalonic acidemia. PA, propionic acidemia. CON, control.

