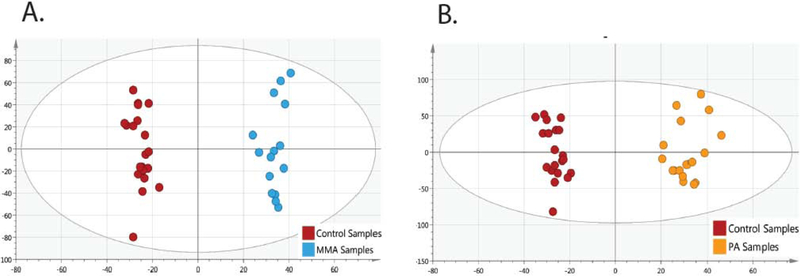
Figure 2.
OPLS-DA score plots show clustering of cohorts. Plots showing the separation of (A) MMA (blue filled circles) to control (red filled circles) and (B) and (orange filled circles) to control (red filled circles) (B) show that disease cohorts are tightly clustered, and there are no significant outliers. MMA, methylmalonic acidemia. PA, propionic acidemia.

