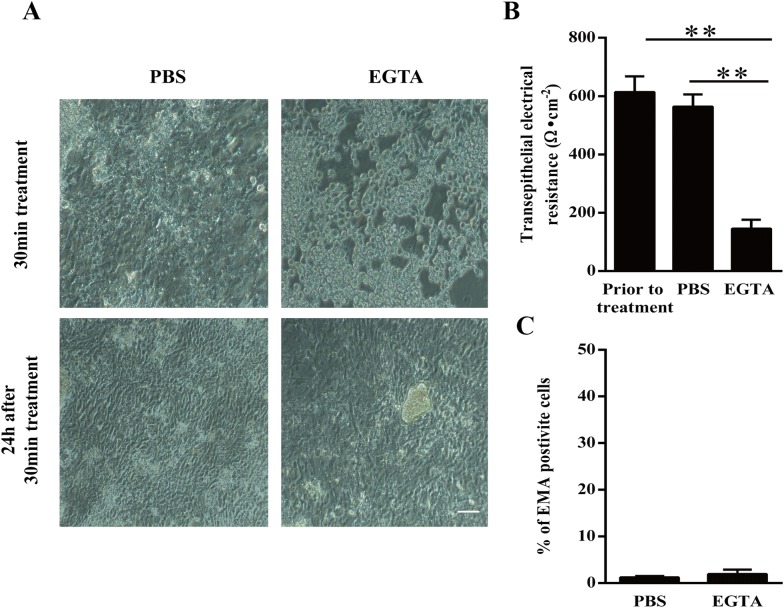
Figure 1.
Disruption and restoration of intercellular junctions in primary enterocytes after EGTA treatment. A Representative microscopic images of enterocytes directly and 24 h after a 30 min treatment with EGTA. Scale bar: 100 µm. B Trans-epithelial electrical resistance of cells prior to treatment and after a 30-min treatment with PBS (control) or EGTA. C The percentage of EMA positive cells 24 h after treatment with PBS or EGTA. Data are expressed as the mean ± SD of the results of three separate experiments. Statistically significant (p < 0.01) differences are indicated with two asterisks.

