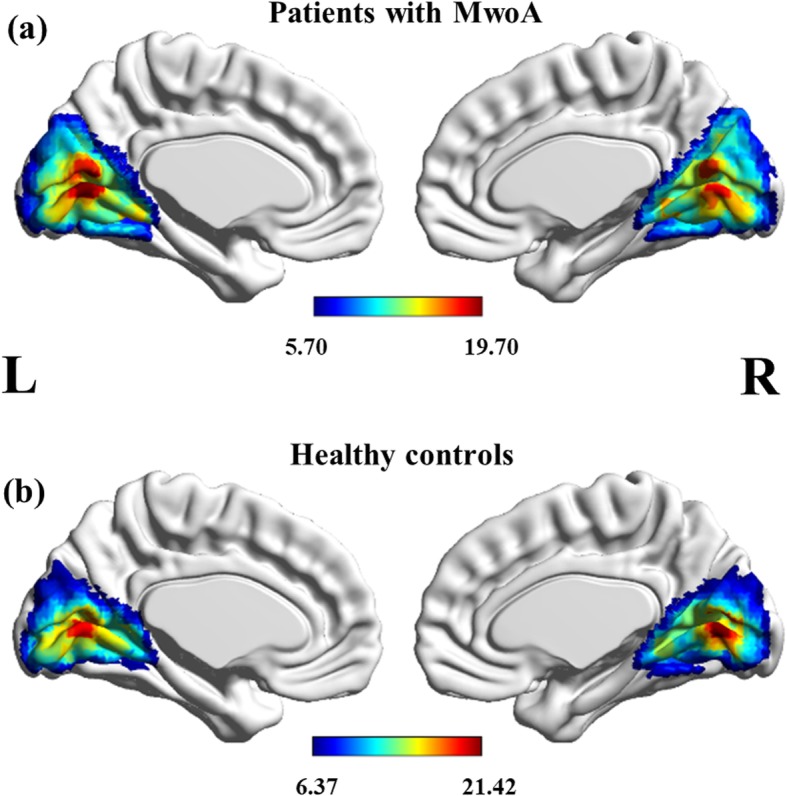
Fig. 1.

Group-level visual network in patients with MwoA (A) and healthy controls (B). Statistical maps were overlaid on the inflated 3D brain surface from the ‘Colin 27’ atlas. Significant thresholds were corrected using cluster-level family-wise error (FWE) correction and set at p < 0.05, cluster size > 30. MwoA: migraine without aura
