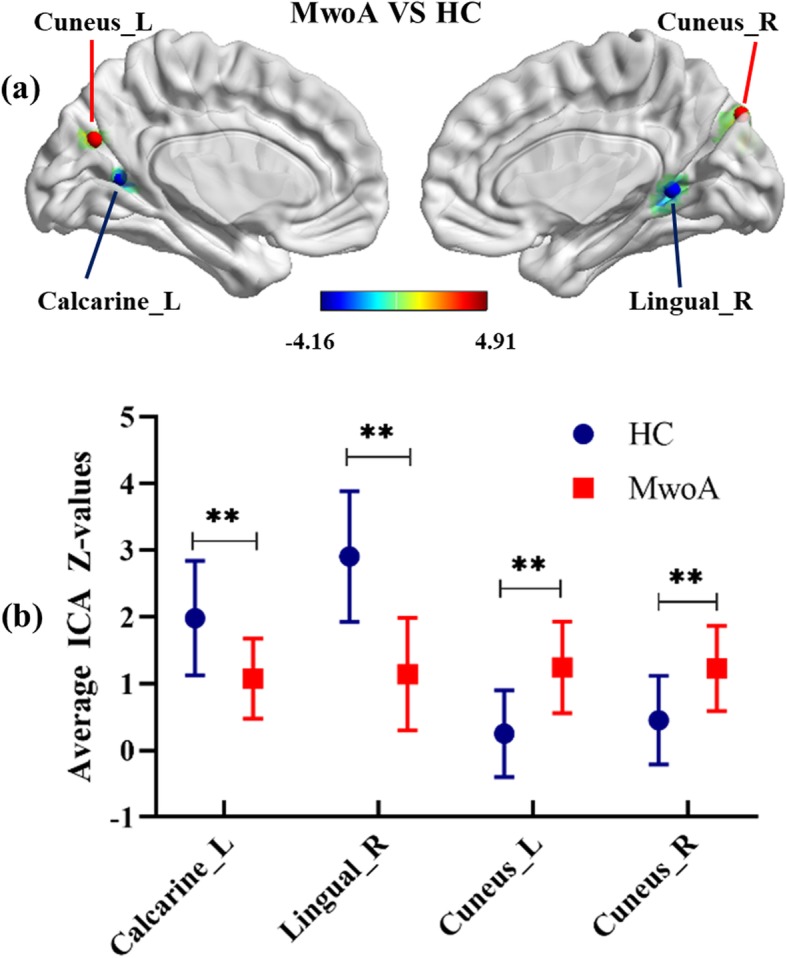
Fig. 2.

T-maps of statistically significant differences within the visual network between patients with MwoA and HC (p < 0.001, uncorrected) (A). Comparison of average ICA Z-values in surviving visual areas between patients with MwoA and HC (B). ICA: independent component analysis; MwoA: migraine without aura; HC: healthy controls; L: left; R: right; **p < 0.001
