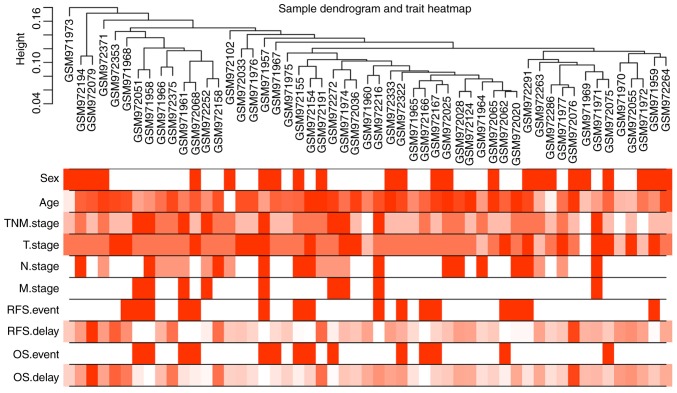
Figure 1.
Sample clustering tree and clinical trait heat map of tumor samples. The cut height was set as 0.2 and there was no deviated sample. The ten traits studied in the present study included sex, age, TNM, TNM-T, TNM-N and TNM-M stage, RFS survival event, RFS delay time, OS event and OS delay time. In the heatmap of clinical traits, red color represents male and white color represents female in sex; the red color depth of age, RFS delay time and OS delay time is proportional to time; the red color depth of TNM and TNM-T stage are divided into 4 scales according to stage 1–4; the red color depth of TNM-N stage is divided into 3 scales according to stage 0–2; the red color depth of TNM-M stage is divided into 2 scales according to stage 0–1; the red color depth of RFS event and OS event are divided into 2 scales according to whether the event occurs or not. TNM, tumor-node-metastasis; RFS, recurrence-free survival; OS, overall survival.

