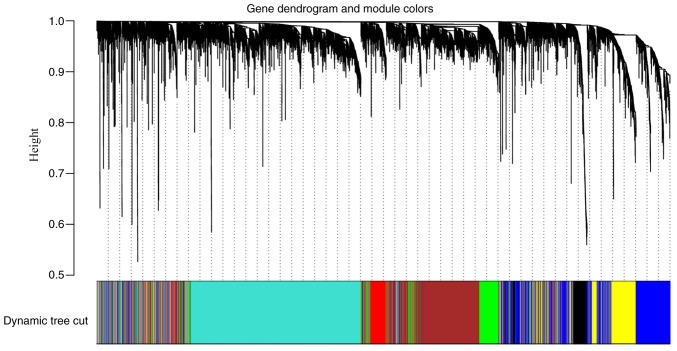
Figure 3.
Clustering dendrograms of all genes, with dissimilarity based on topological overlap, together with assigned module colors. The dynamic tree cut algorithm was applied to the dendrogram for module identification. Different colors represent different gene modules and there are seven co-expressed modules in the weighted gene co-expression network analysis network, including red, brown, green, turquoise, black, blue and yellow.

