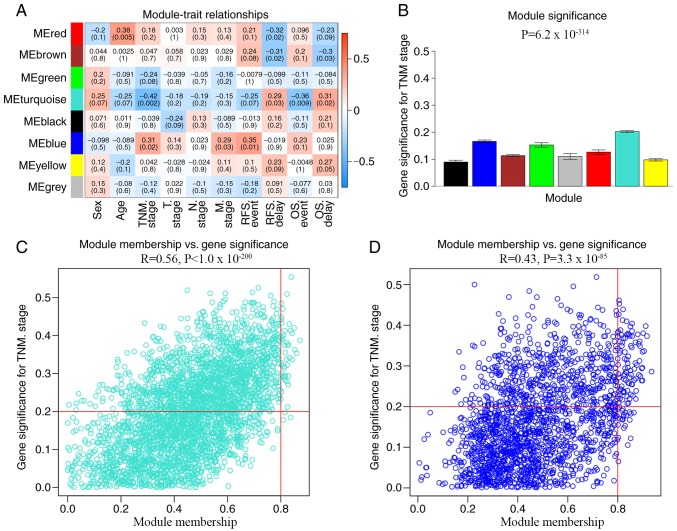
Figure 4.
Identification of significant modules associated with clinical traits and screening module hub genes. (A) Correlation of module eigengenes with all traits. Each unit contains the corresponding correlation coefficient and P-value. The table is color-coded by correlation according to the color legend. (B) Distribution of TNM stage-related genes in all modules. Modules and enrichment significance are presented on the x- and y-axis, respectively. Scatterplots of GS for metastasis vs. MM in the (C) turquoise and (D) blue modules. The corresponding correlation coefficient and P-value are listed above the scatterplot. The horizontal red lines indicate GS=0.2 and the vertical red lines indicate MM=0.8. TNM, tumor-node-metastasis; GS, gene significance; MM, module membership.

