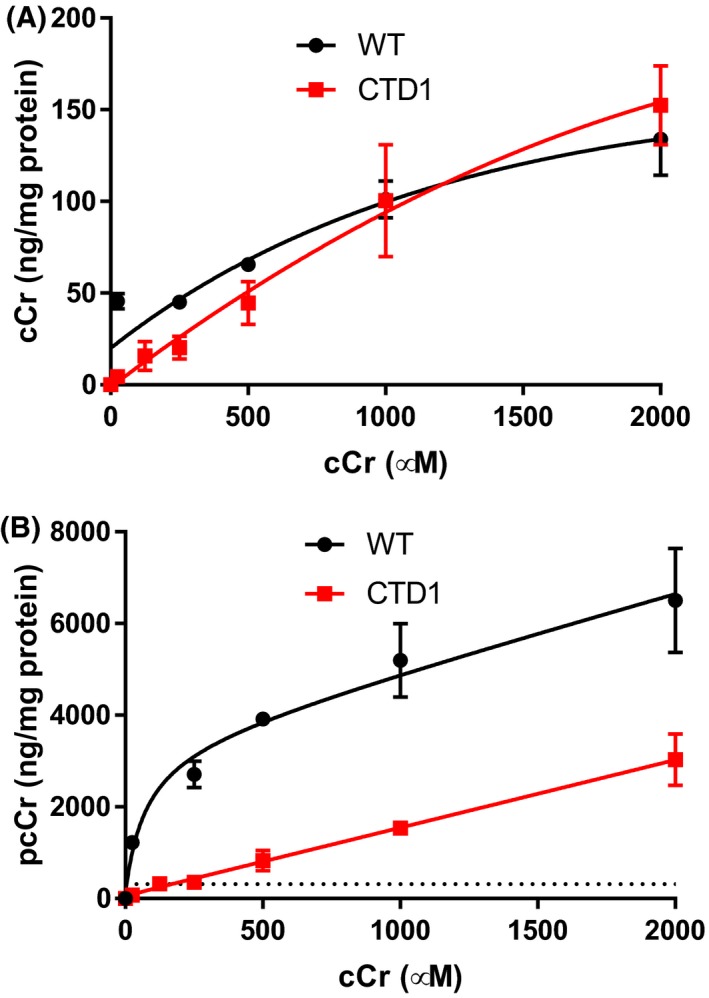
Figure 3.

cCr uptake increases with increasing concentrations of cCr (A) After 72 h, cCr concentration‐dependent increases in pcCr in WT and CTD patient fibroblasts. Dotted line indicates concentration of cCr (24.9 µg/mL or 174 µmol/L) required to achieve endogenous concentration of pcCr (318.7 ng/mL). (B) After 72 h, cCr concentration‐dependent increases in cCr in WT and CTD patient fibroblasts. Measurements normalized to total protein. Data fit using non‐linear regression
