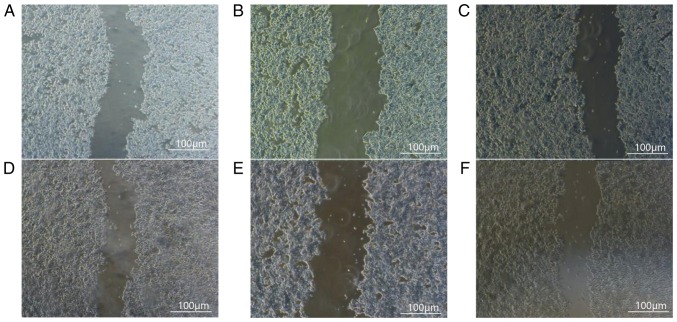
Figure 3.
Changes in the migratory ability of cells following FoxM1-silencing. (A) Blank control group, (B) meaningless sequence group and (C) experimental group at 0 h. (D) Blank control group, (E) meaningless sequence group and (F) experimental group at 24 h. Scale bar, 100 µm. FoxM1, Forkhead box transcription factor M1.

