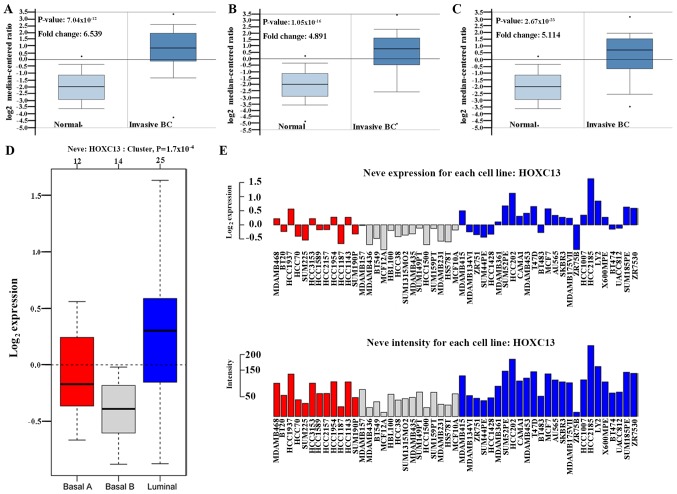
Figure 2.
HOXC13 expression analysis in different breast cancer subtypes. Box plots represent the expression of HOXC13 in invasive breast cancer from the Oncomine database. (A) Invasive BC (invasive lobular breast carcinoma): P-value=7.04×10⁻¹². (B) Invasive BC (invasive breast carcinoma): P-value=1.05×10⁻¹⁶. (C) Invasive BC (invasive ductal breast carcinoma): P-value=2.67×10⁻²³. (D-E) Red represents breast cancer subtype basal A, gray represents breast cancer subtype basal B, and blue represents breast cancer subtype luminal. (D) Using GOBO analysis, in various subtypes of breast cancer, the HOXC13 expression was significantly higher in luminal-like breast cancer: P=0.00017. (E) GOBO analysis showing the expression of HOXC13 in each breast cancer cell line. BC, breast carcinoma; GOBO, Gene expression-based Outcome for Breast cancer Online; HOXC13, homeobox C13. The neve expression refers to the base two logarithm of the expression of the gene in each cell, and the neve intensity refers to the expression level of each breast cancer cell relative to the expression of the internal reference.

