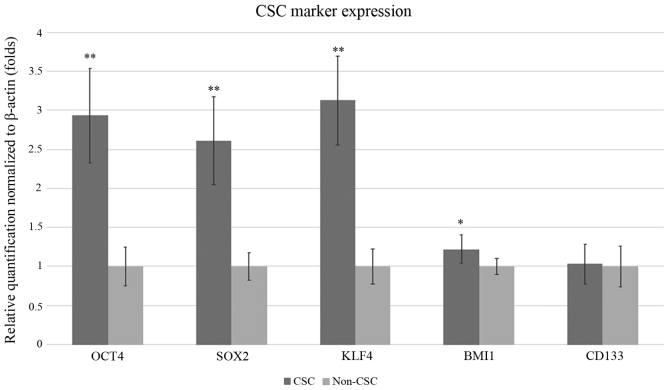
Figure 3.
Reverse transcription-quantitative PCR results of CSC marker expression normalized to β-actin expression. Relative expression of CSC and non-CSC for markers CD133, OCT4, SOX2, KLF4 and BMI1 are presented as fold changes. CSC expression levels for markers CD133, OCT4, SOX2, KLF4 and BMI1 were compared to non-CSC expression levels of the same genes. Error bars represent the mean ± SD of at least quadruplicate samples of three independent experiments. *P<0.05 and **P<0.01 vs. non-CSC. CSC, cancer stem cell; KLF4, Kruppel-like factor; BMI1, BMI1 proto-oncogene, polycomb ring finger.

