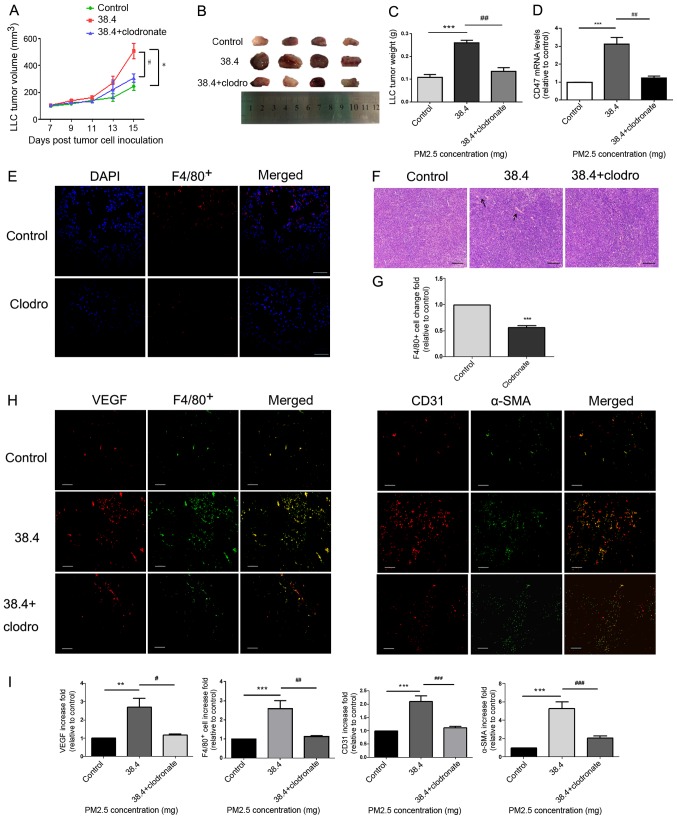
Figure 3.
Pro-angiogenic and macrophage accumulation effects of PM2.5 in a tumor-bearing model. (A) LLC cells were inoculated into C57BL/6 mice for 15 days, and intratracheal instillation normal saline or 38.4 mg PM2.5 was administered on days 7, 10 and 13. Tumor length and width were measured every other day beginning 7 days after LLC cell inoculation. Tumor volume was calculated using the following formula: Volume=Length × Width2 ×0.5. Mice treated without PM2.5 were used as a control. *P<0.01 vs. control; #P<0.05 vs. 38.4 mg exposure group. (B) Tumor images were obtained after mice were euthanized on the fifteenth day of cell inoculation (n=4). (C) Tumor weight was highest in the 38.4 mg PM2.5 exposure group compared with the control and macrophage depletion groups. (D) Tumor tissue CD47 mRNA expression was measured using reverse transcription-quantitative PCR. ***P<0.01 vs. control; ##P<0.01 vs. 38.4 mg exposure group. (E) Clodronate liposomes or normal saline were intratracheally instilled to mice. F4/80+ immunofluorescence was used to test the efficiency of macrophage depletion. Scale bar, 100 µm. (F) Hematoxylin and eosin staining was used to observe angiogenesis in tumor tissues. Scale bar, 50 µm. Arrows indicated vessel. (G) Immunofluorescence quantification for F4/80+ cells was performed using ImageJ v5.0 software. The clodronate group exhibited decreased macrophage accumulation in lung tissues compared with the control group. Data are presented as the mean ± SD and were analyzed using a t-test. (H) Increased macrophage recruitment, VEGF protein release and microvessel formation were detected in response to PM2.5 exposure. VEGF and F4/80+ staining indicated macrophage recruitment and angiogenic protein secretion. Microvessel formation in tumor tissues was examined using CD31 and α-SMA staining, which mark endothelial cells and vascular smooth muscle cells, respectively. Scale bar, 50 µm. (I) Immunofluorescence quantification for VEGF, F4/80+, CD31 and α-SMA was performed using ImageJ v5.0 software. VEGF, F4/80+, CD31 and α-SMA immunofluorescence were significantly increased in the PM2.5 exposure group compared with in the control group. Data are presented as the mean ± SD and were analyzed by one-way ANOVA. **P<0.01 vs. control; ***P<0.001 vs. control; #P<0.05 vs. 38.4 mg exposure group; ##P<0.01 vs. 38.4 mg exposure group; ###P<0.001 vs. 38.4 mg exposure group. PM, particle matter; LLC, Lewis lung carcinoma; VEGF, vascular endothelial growth factor; α-SMA, α smooth muscle actin; clodro, clodronate.

