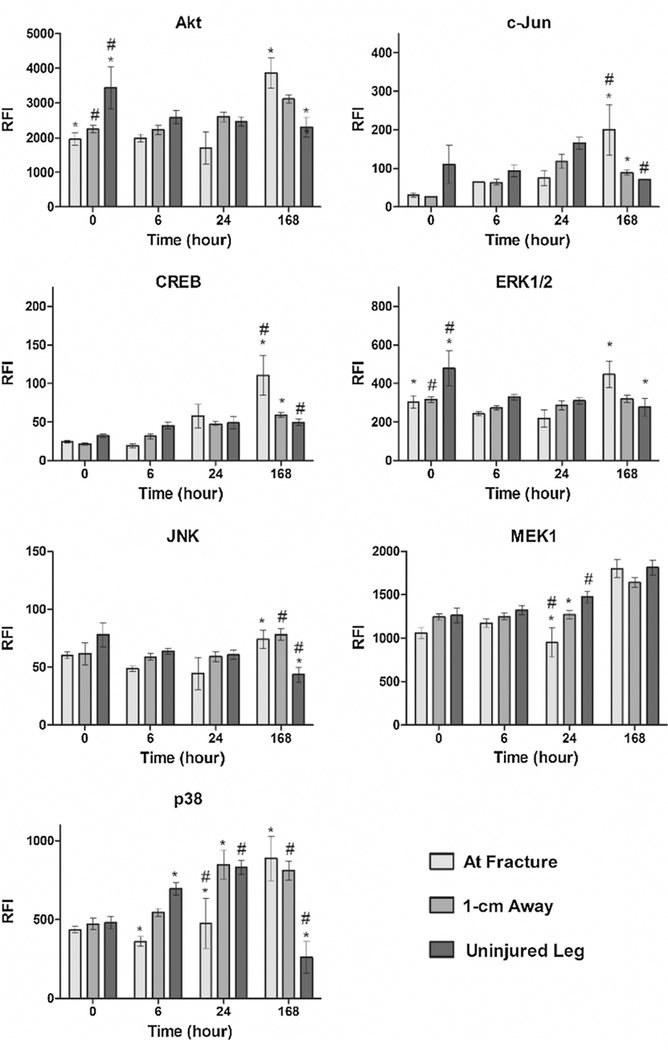
Fig. 1.
Total protein concentration measured across time and location in response to a traumatic injury. Relative fluorescence intensity (RFI) associated with total protein concentrations of the following proteins were assayed across four time points and three different locations following the femur fracture: Akt, c-Jun, CREB, ERK1/2, JNK, MEK1, and p38. Statistically significant differences (p < 0.05) in protein concentration between different locations are marked with matching symbols (* or #). Error bars reflect ± standard error of the mean.

