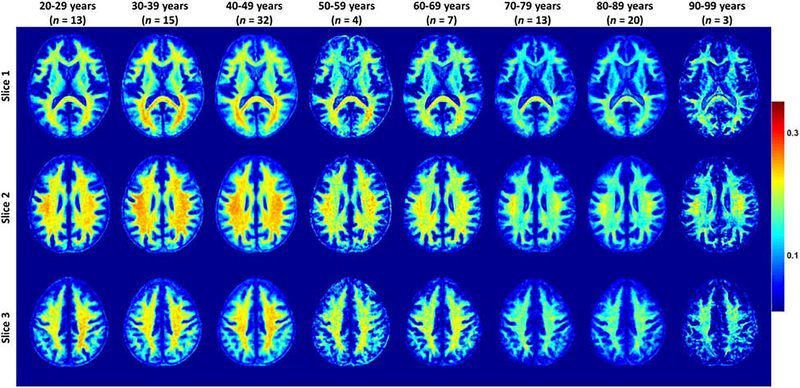
Figure 3.
Myelin water fraction (MWF) represented as averaged participant maps calculated over 10-year intervals. Results are shown for three representative slices. Visual inspection of MWF maps shows an increase in MWF values from early age until middle age, that is, 40–49 year, followed by a more rapid decrease in several brain regions. This suggests progressive myelination continuing into middle age followed by a decline in myelin content at older ages.

