
Figure 3.
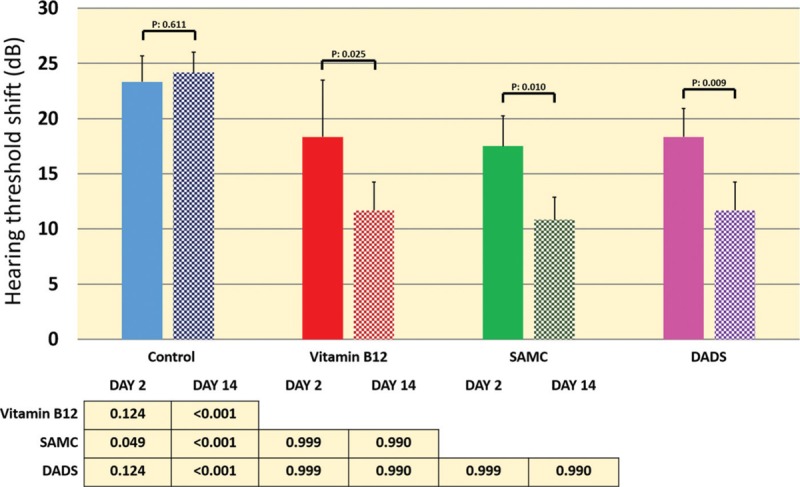
HTS obtained from tonal auditory brainstem response tests (8 kHz) on the 2nd and 14th day after noise exposure are presented. The table in the figure indicates the results of one-way analysis of variance test and post hoc Bonferroni test results for the measurements of the 2nd and 14th day. P values represented above the bars are indicating the comparison between the 2nd and 14th day (paired t-test) (recuperation level) within each of the study group. dB = decibel