FIGURE 3.
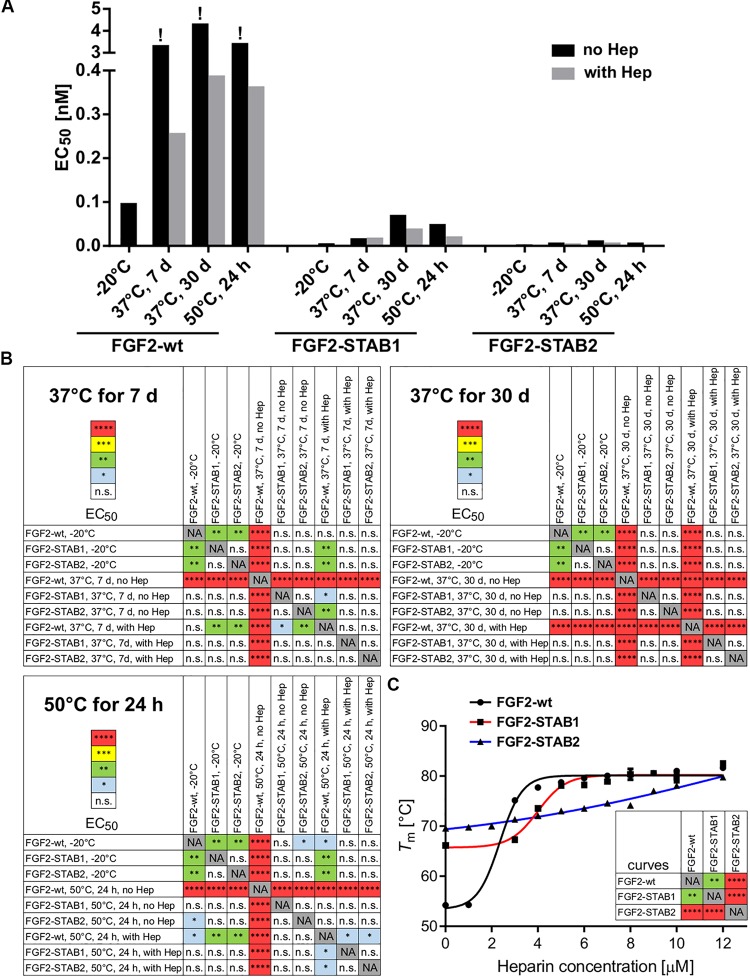
FGF2-STABs show increased thermal stability, as indicated by their lower EC50 values. (A) The bar plot presents EC50 values of FGF2 variants after thermal treatments, calculated from data presented in Figure 2A. The exclamation mark (!) indicates EC50 values that are only rough estimates from the available data; however, true EC50 values are most likely higher because at the range of concentrations tested, maximum response was not reached. (B) The color maps show results of statistical analysis of EC50 values of FGF2 variants after thermal treatment, calculated from data presented in Figure 2A. ∗P < 0.05; ∗∗P < 0.01; ∗∗∗P < 0.001; ****P < 0.0001; n.s., not significant (one-way ANOVA, Tukey’s multiple comparisons test). NA, not applicable. (C) Dependence of the melting temperature (Tm) of the FGF2 variants on heparin concentration. The data were fitted to sigmoidal curves. The color maps show results of statistical comparison of whole curves (two-way ANOVA). ∗∗P < 0.01; ****P < 0.0001. NA, not applicable.

