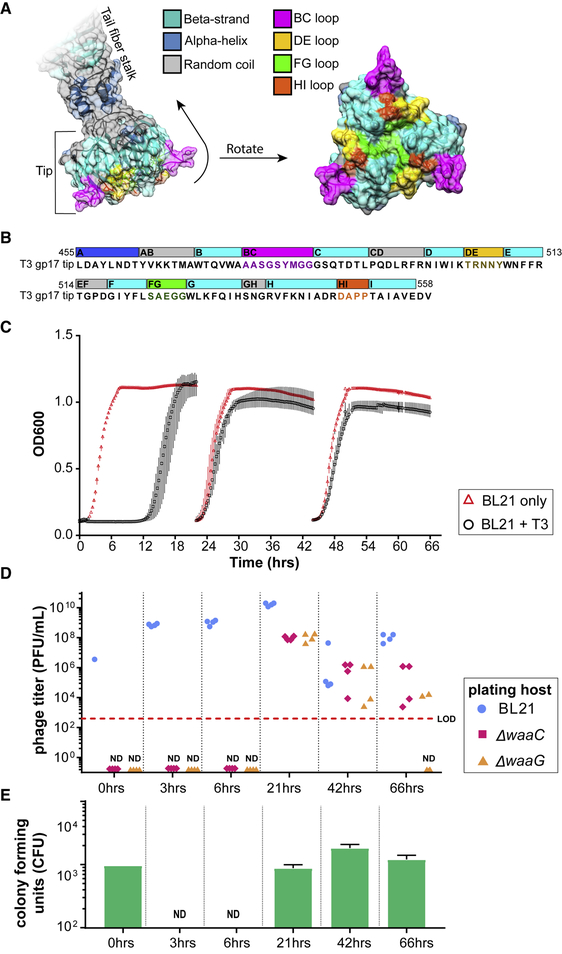
Figure 2. Computational Structure of T3 gp17 and Emergence of Resistance to T3 Infection.
(A) Three-dimensional structure of the tail fiber tip domain of phage T3 as modeled by SWISS-MODEL. The molecular surface that include residues belonging to the BC, DE, FG, and HI loops are highlighted in bright colors (magenta, green, gold, and orange, respectively) to illustrate their possible contribution to host binding.
(B) Sequence of the T3 tail fiber tip (455–558 amino acids of the gp17 fragment) modeled in (A) with the same corresponding color scheme of structural features highlighted in the three-dimensional model.
(C) Bacterial kinetic growth curves of BL21 on its own (red triangles) or BL21 infected with WT T3 (black circles). BL21 cultures were infected with WT T3 and reseeded every 24 h into fresh LB medium. Data shown as the mean ± SD from three experiments.
(D) Phage titers of the evolved T3 lysates on the parental host (BL21, blue circles) as well as on ΔwaaG (orange triangles) and ΔwaaC (red diamonds) were measured at the indicated time points.
(E) At the indicated time points, aliquots of the lysates were washed, serially diluted, and plated to quantify the number of viable bacteria (CFUs) (green bars; results presented as mean; error bars are ± SD from three experiments; LOD, limit of detection; ND, not detected). T3 mutants that infect ΔwaaG and ΔwaaC appear during co-evolution with WT BL21, but these mutants in the evolved lysates are not capable of preventing resistance in culture or colonies from appearing in the plate resistance assay.
See also Table S1.

