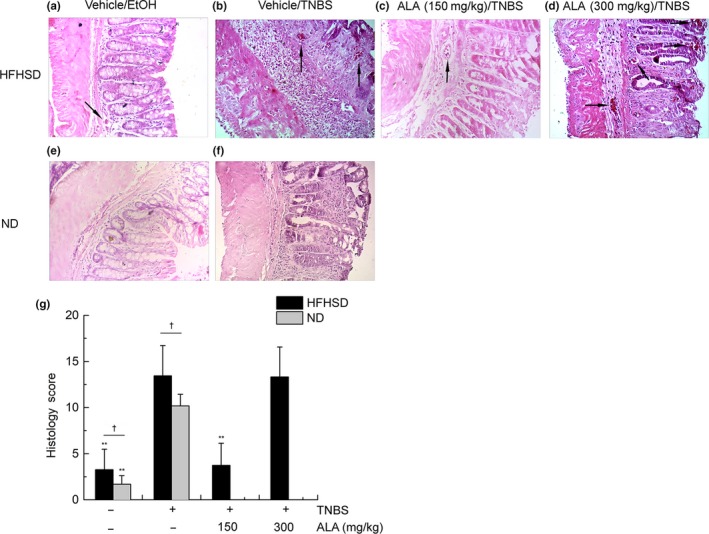
Figure 2.

The effect of alpha‐linolenic acid (ALA) and high‐fat, high‐sugar diet (HFHSD) on colonic histology of trinitrobenzene sulfonic acid (TNBS)‐induced colitis mice. (a) Histological image (H&E stain) of vehicle/EtOH treatment group fed by HFHSD, (b) histological image (H&E stain) of vehicle/TNBS treatment group fed by HFHSD, (c) histological image (H&E stain) of low‐ALA/TNBS treatment group fed by HFHSD, and (d) histological image (H&E stain) of high‐ALA/TNBS treatment group fed by HFHSD. Black arrows in (a–d) indicate infiltration of inflammatory cells. (e) Histological image (H&E stain) of vehicle/EtOH treatment group fed by HFHSD, (f) histological image (H&E stain) of vehicle/TNBS treatment group fed by HFHSD, (g) histology scores. Values are expressed as mean ± standard deviation, (n = 9). Significant difference between HFHSD‐fed groups was analyzed by comparing to the vehicle/TNBS group, *p < .05, **p < .01. Besides, significant difference between different diet‐fed groups was analyzed by comparing between the same intrarectal administration groups, † p < .05
