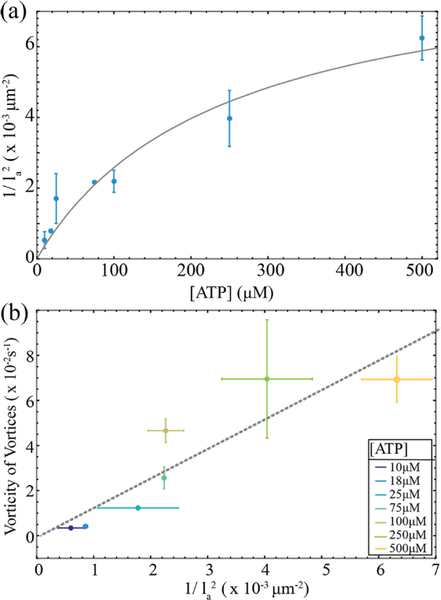
Figure 6: Dependence of the active stress on the ATP concentration.
(a) The estimate of the the active stress, as a function of the ATP concentration. The full line indicates the theoretical fit of the active stress which scales as where ν is the filament extension velocity that is described by the Michaelis-Menten kinetics (Eq. 5). The experimental fit parameters are where the error is the standard error on the fit parameters. The active length scale, la, is extracted from the vortex size distributions measured at different ATP concentrations. The error bars are the standard deviation of active length scale from different experiments. (b) Comparison of two different methods of extracting active stresses. One method relies on the estimate of the active stress from vorticity relationship α ~ η < ω >ν, while the other uses: . The colors indicate the ATP concentration at which the two measurements are compared. Gray line is a linear fit of the data.

