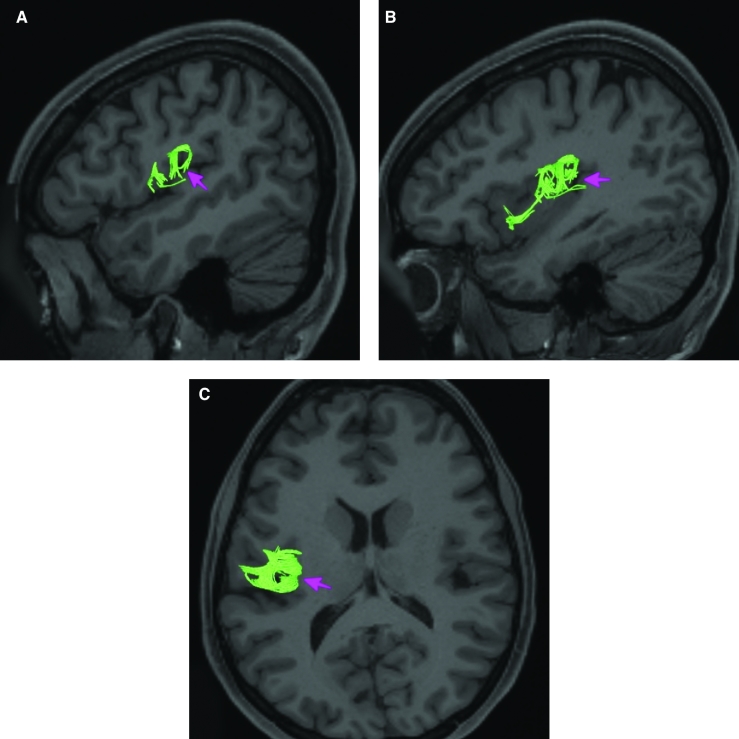
FIGURE 26.
Structural connectivity of Ig in the left hemisphere, shown on T1-weighted MR images. Sagittal views of A, lateral and B, medial planes. C, Axial view. Green: white matter tracts of Ig demonstrating connections with local parcellations and MI. Pink arrows designate the parcellation of interest.

