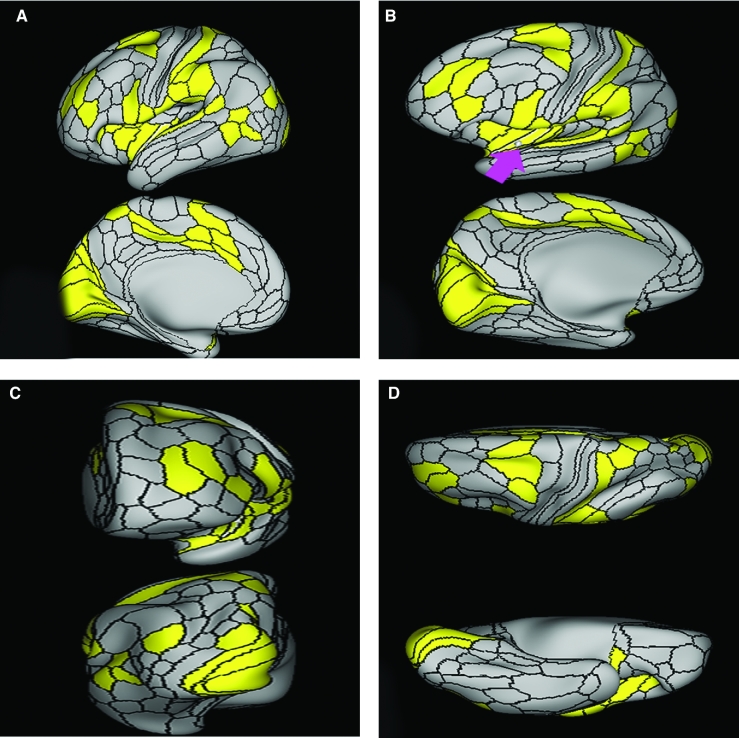
FIGURE 53.
Functional connectivity of Pol1 demonstrated on an inflated left hemisphere. A, Lateral and medial views. B, Oblique view. C, Rostral and caudal views. D, Dorsal and ventral views. Parcellations with the strongest functional connectivity are shown in yellow. Pink arrows designate the parcellation of interest.

