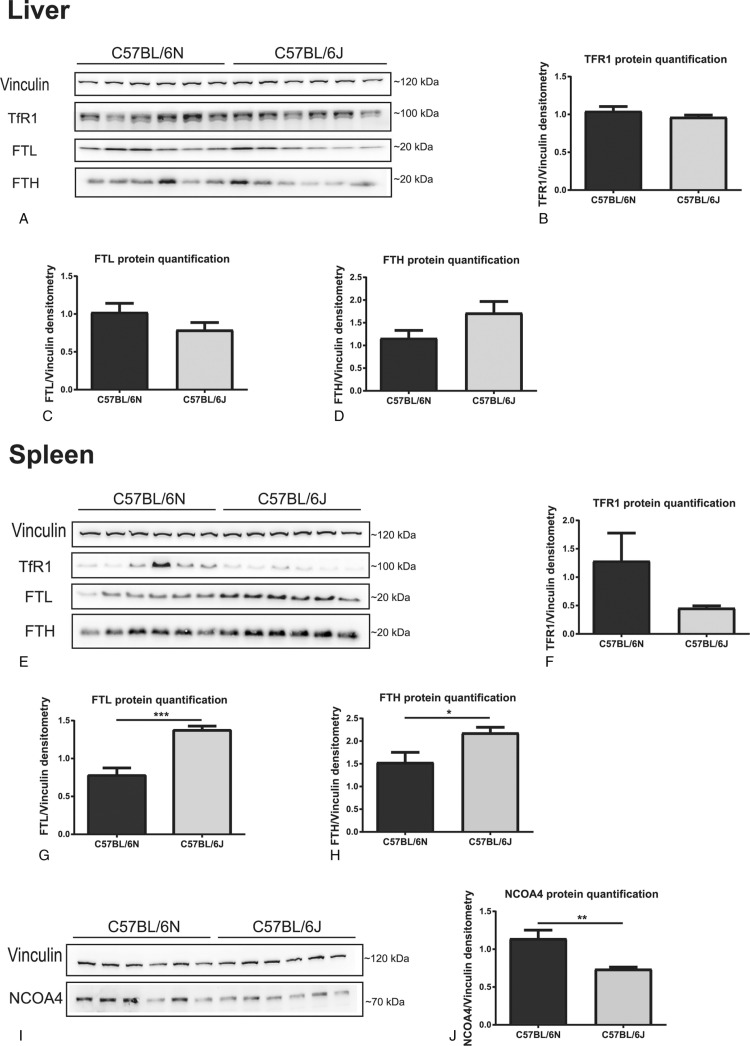
Figure 1.
C57BL/6J mice show increased spleen, but not liver, ferritin levels, in comparison with C57BL/6N mice. Liver: (A–D) Western-blot analysis (n = 6) of hepatic TFR1 (A,B), FTL (A,C) and FTH (A,D). Spleen: (E-F) Western-blot analysis (n = 6) of splenic TFR1 (E,F), FTL (E,G) and FTH (E,H). (I,J) Western-blot analysis (n = 6) of splenic NCOA4. Vinculin was used as a loading control for western-blots. One representative loading control is shown. Data are reported as mean ± SEM. Student's t test: ∗p < 0.05; ∗∗p < 0.01; ∗∗∗p < 0.001.

