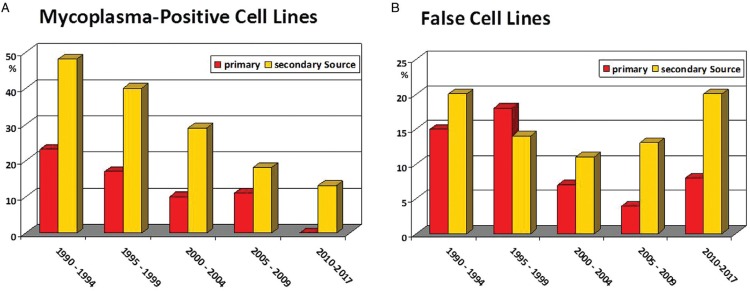
Figure 1.
Incidences of mycoplasma-positive and false leukemia-lymphoma cell lines. This cell lines-based-analysis used data on overall 792 cell lines which were examined by mycoplasma detection assays (A) and on overall 878 cell lines which were subjected to DNA authentication methods (B); cell lines were received between 1990 and 2017. Shown are the percentages of mycoplasma-positive and false (cross-contaminated) cell lines for the calendar periods indicated on the X-axis. The source of cell lines is indicated in the key of each panel: primary sources (red columns) vs secondary sources (orange columns). Updated from reference.5.

