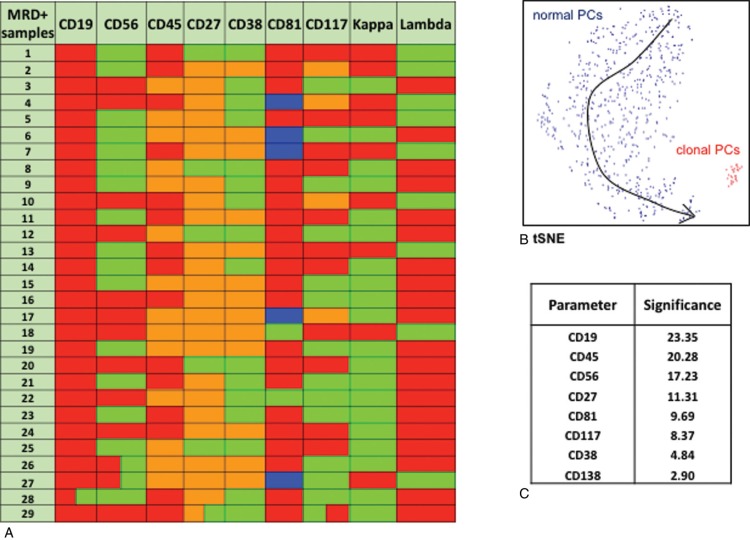
FIGURE 2.
A. Phenotypic heterogeneity of clonal plasma cells among MRD+ cases. Each row depicts the unique phenotypic profile of aberrant cells in each case. Red: negative; Green: positive; Orange: dim expression; Blue: negative to dim expression. B. t-SNE representation of the phenotypic discrimination between normal (blue) and abnormal (red) cells in an exemplificative MRD+ case with low tumor burden. C. Relevant significance of each marker used for distinguishing clonal plasma cells. The table shows the cumulative mean value of each marker for all 29 MRD+ cases.

