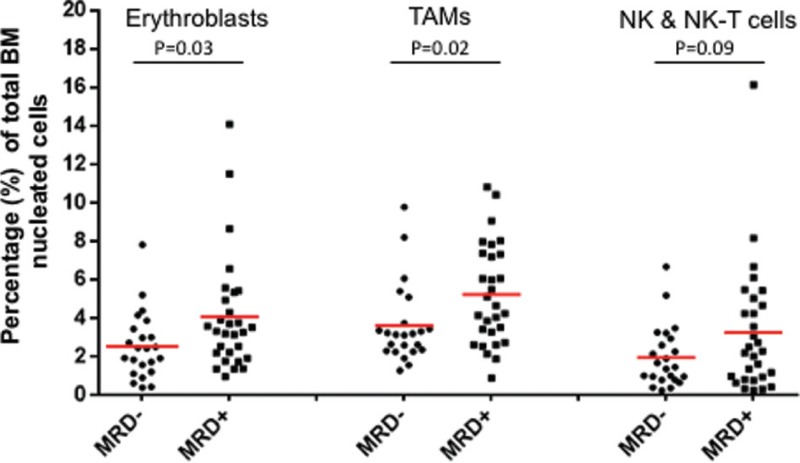
FIGURE 4.
Differences in the bone marrow niche profile among MRD+ and MRD− patients. Each dot represents the respective value of a single MM patient. The red line shows the mean value in each group. TAMs = tumor-associated monocytes/macrophages, NK = natural killer cells, NK-T = natural killer T cells.

