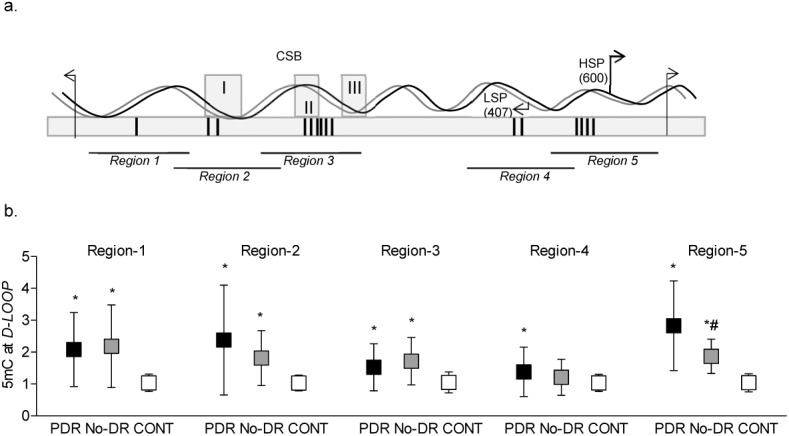
Figure 3.

DNA methylation of different CpG-rich regions of the D-Loop. (a) Schematic diagram of five regions of the D-Loop (16024-576 bp region) with differential CpG density. Vertical bars in the box represent CpG density; 1, 2, 6, 2, and 4 CpG sites, respectively. Regions 2 and 3 also cover three conserved sequence box domains (CSB-I, II, and III), and region 4 and 5 have light strand promoter (LSP) and heavy strand promoter (HSP), respectively. (b) 5mC levels in the regions 1 to 5 of the D-Loop were quantified in immunoprecipitated samples using a MeDIP kit. *,#P < 0.05 versus CONT and PDR groups, respectively.
