
Figure 4.
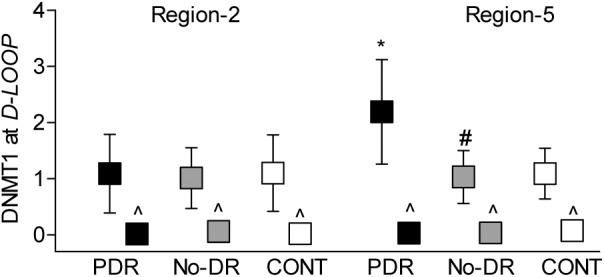
DNMT1 binding at the D-Loop. Regions 2 and 5 of the D-Loop were analyzed for DNMT1 binding by ChIP technique; IgG was used as an antibody control (^). The values are represented as mean ± SD. *P < 0.05 versus CONT and #P < 0.05 versus PDR.
Official websites use .gov
A
.gov website belongs to an official
government organization in the United States.
Secure .gov websites use HTTPS
A lock (
) or https:// means you've safely
connected to the .gov website. Share sensitive
information only on official, secure websites.
DNMT1 binding at the D-Loop. Regions 2 and 5 of the D-Loop were analyzed for DNMT1 binding by ChIP technique; IgG was used as an antibody control (^). The values are represented as mean ± SD. *P < 0.05 versus CONT and #P < 0.05 versus PDR.