Figure 6.

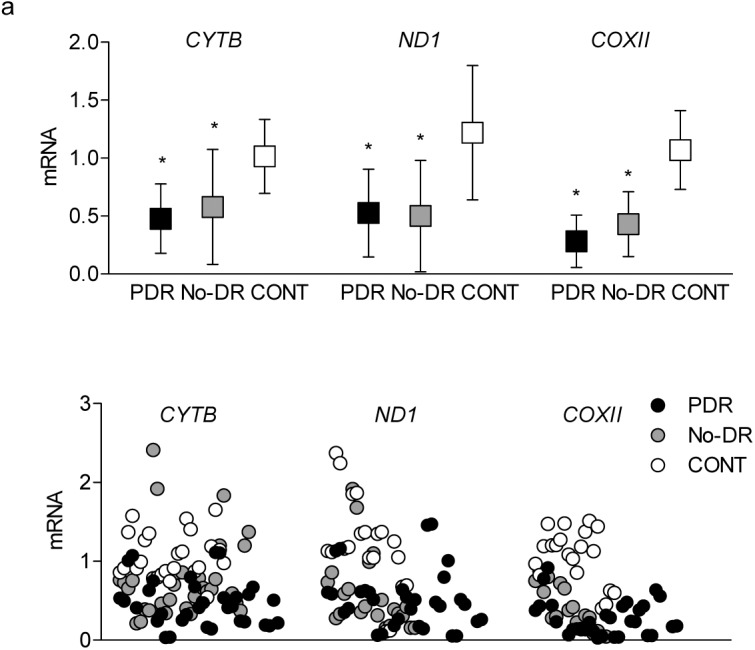
Transcripts of mtDNA-encoded genes. Gene transcripts of CYTB, ND1, and COXII were quantified in the cDNA using qPCR, and the data obtained were normalized against the values from β-ACTIN by the ddCt method. *P < 0.05 versus CONT.

Transcripts of mtDNA-encoded genes. Gene transcripts of CYTB, ND1, and COXII were quantified in the cDNA using qPCR, and the data obtained were normalized against the values from β-ACTIN by the ddCt method. *P < 0.05 versus CONT.