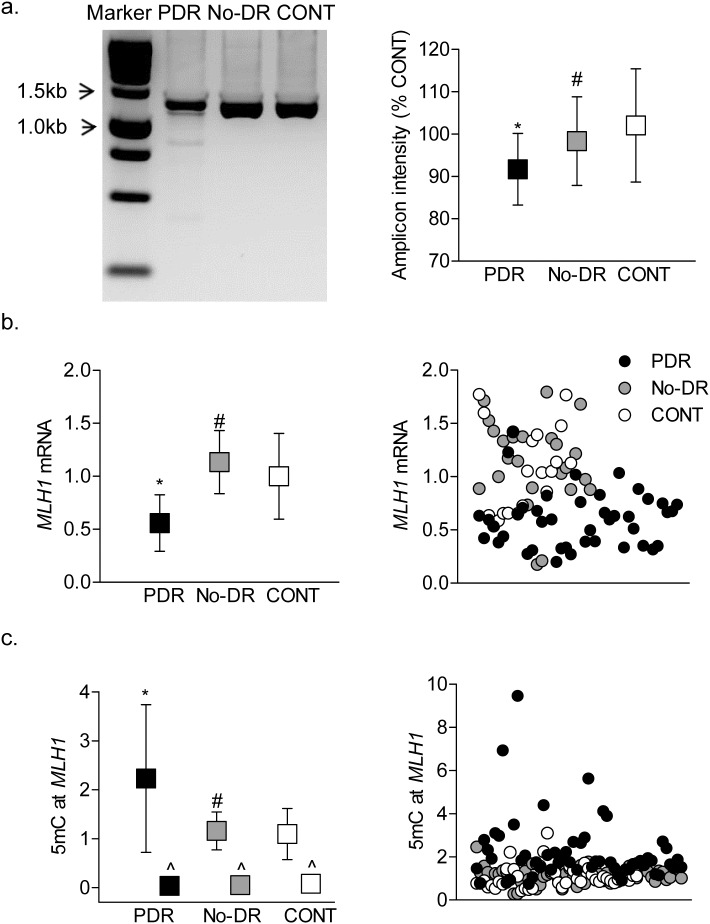
Figure 7.
Mismatches in the D-Loop. (a) Base mismatches in the D-Loop were analyzed after digesting the complete D-Loop amplicons with mismatch-specific surveyor nuclease, followed by resolving in agarose gel for fragmentation analysis and quantification of the amplicon intensity. The intensity of the amplicon in the CONT group was considered as 100%. (b) Gene transcripts of MLH1 were quantified by qPCR using β-ACTIN as a housekeeping gene. (c) 5mC levels in the MLH1 promoter were quantified by methylated DNA immunoprecipitation technique using IgG as an antibody control (^). The data are mean ± SD obtained from 12 to 20 subjects in each group. *P < 0.05 versus CONT and #P < 0.05 versus PDR.

