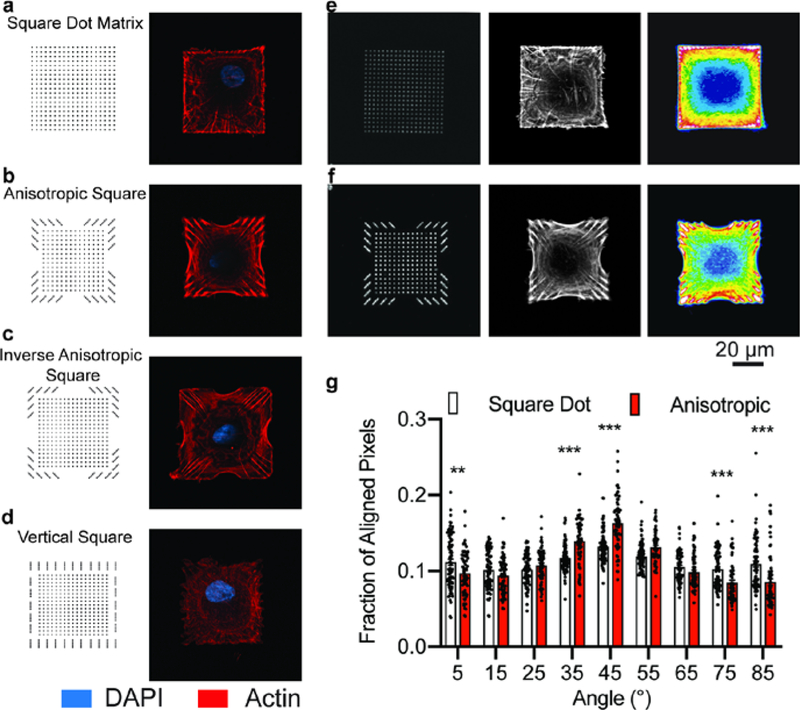
Figure 1. Actin fiber orientation within cells on square substrates.
a-d, Pattern designs (left) and representative fluorescence micrographs of the actin cytoskeleton in hMSCs seeded on each pattern (right). e, Fluorescence image of fibronectin patterned as a square dot matrix (left), representative fluorescence image of the actin cytoskeleton of a cell on a square dot matrix pattern (center), heatmap of the average actin fiber staining intensity across population of cells on the square dot matrix substrate (n=78; right). f, Fluorescence image of fibronectin patterned as an anisotropic square (left), representative fluorescence image of the actin cytoskeleton of a cell on an anisotropic square pattern (center), heatmap of the average actin fiber staining intensity across populations of cells on the anisotropic square substrate (n=64; right). g, The actin fiber orientation within cells on anisotropic and square dot matrix patterns. (mean ± s.e.m.; ** p<0.01, *** p<0.001, two-way ANOVA with Bonferroni post hoc).

