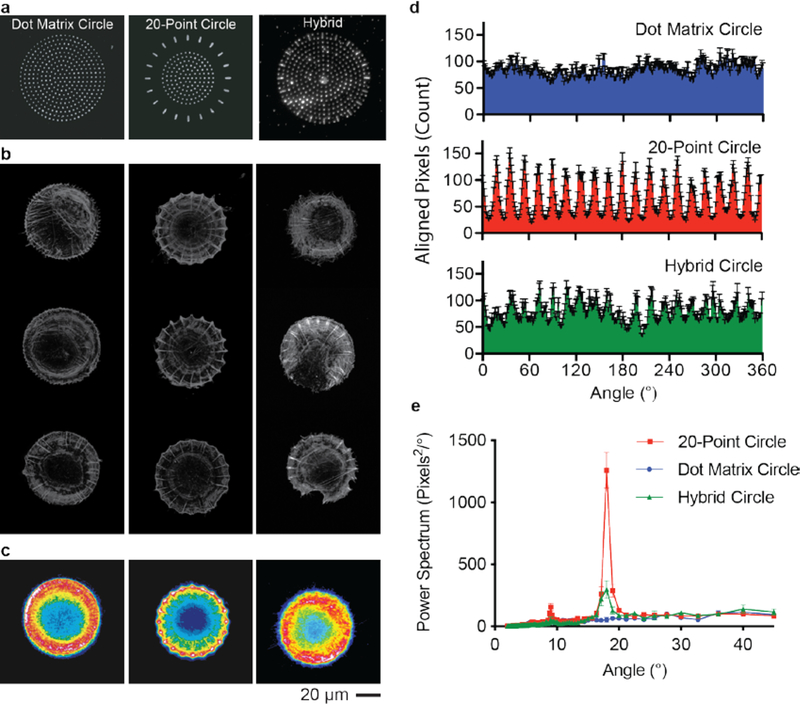
Figure 2. Actin fiber orientation within cells on circular substrate.
a, Fluorescence micrograph of fibronectin patterned in different circular shapes. b, Representative fluorescence images of the actin cytoskeleton of cells seeded on each pattern. c, Heatmap of the average actin fiber staining intensity across populations of cells on each circle pattern (n=84), 20-point circles (n=57), and hybrid circles (n=46). d, The angular distribution of radial fibers within the cells on all three circular patterns (mean ± s.e.m.). e, FFT of the angular distribution of the radially oriented actin fibers (mean ± s.d.).

