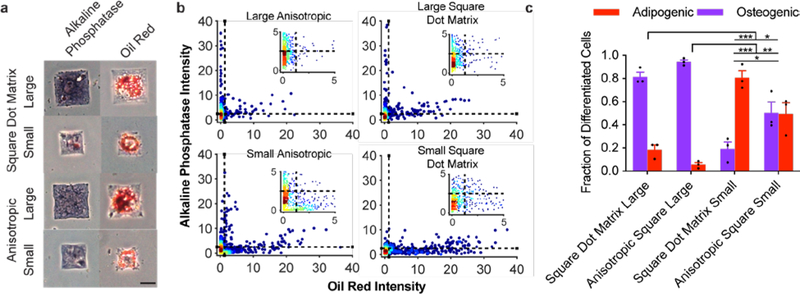
Figure 4. Osteogenic and adipogenic differentiation on square patterns.
a, Brightfield images of cells on each respective pattern strongly staining purple, as an osteogenic marker (left column), or red, as an adipogenic marker (right column). Scale bar: 25 μm. b, Scatter plots for staining intensity of individual cells after color deconvolution of the red and purple channels from 3 substrates (ncells = 759–817). c, Percentage of cells staining positive for only adipogenic or osteogenic markers (mean ± s.e.m.; *** p<0.001; * p<0.05; one-way ANOVA with Tukey HSD).

