
Figure 1: Exploratory analysis of 4 genera.
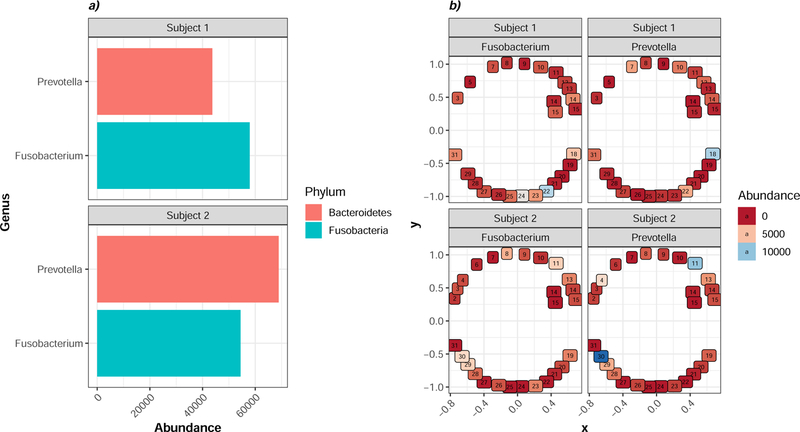
a) The absolute abundance (x-axis) of Prevotella and Fusobacterium is plotted (y-axis) for each of 2 individuals. Each bar is shaded by the Phylum to which the taxon belongs. b) the site-specific abundance of each Genus was visualized for each site for Subject 1 (Left) and Subject 2 (Right). Similar colors represent similar abundance values: red indicates low; pink intermediate; and blue high abundance values for each taxon at that site. Numbers within each circle correspond to universal tooth number.