
Figure 2: Subgingival communities, like supragingival communities, may conform to an ecological gradient.
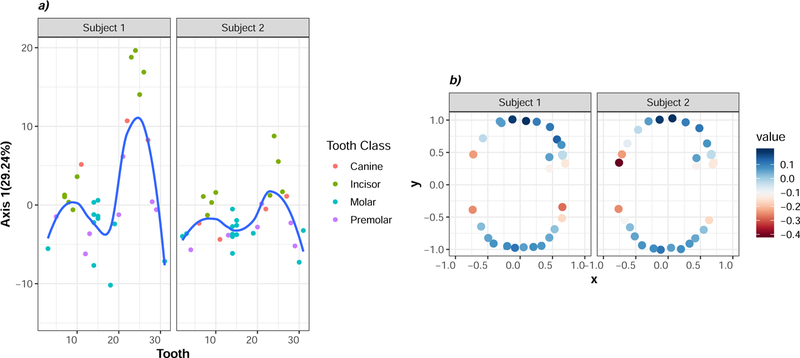
a) Trend surface analysis was used to examine spatial patterning at subgingival sites. Scores from the first principal component (y-axis) is plotted against universal tooth number (x-axis). Each point represents a sample that is colored according to tooth class (canine, incisor, molar, premolar). The blue line is a loess smoothened curve surrounded by 95% confidence intervals in grey. b) MEM was used to evaluate spatial patterning in subgingival samples from the same subjects. Each point represents a tooth plotted against the x- and y- geographic coordinates of sample sites. Points are shaded with a heatmap scale according the first RDA axis. The trend surface and MEM models both suggest communities vary along an ecological gradient that distinguishes between sites across the anterior-to-posterior dimension.