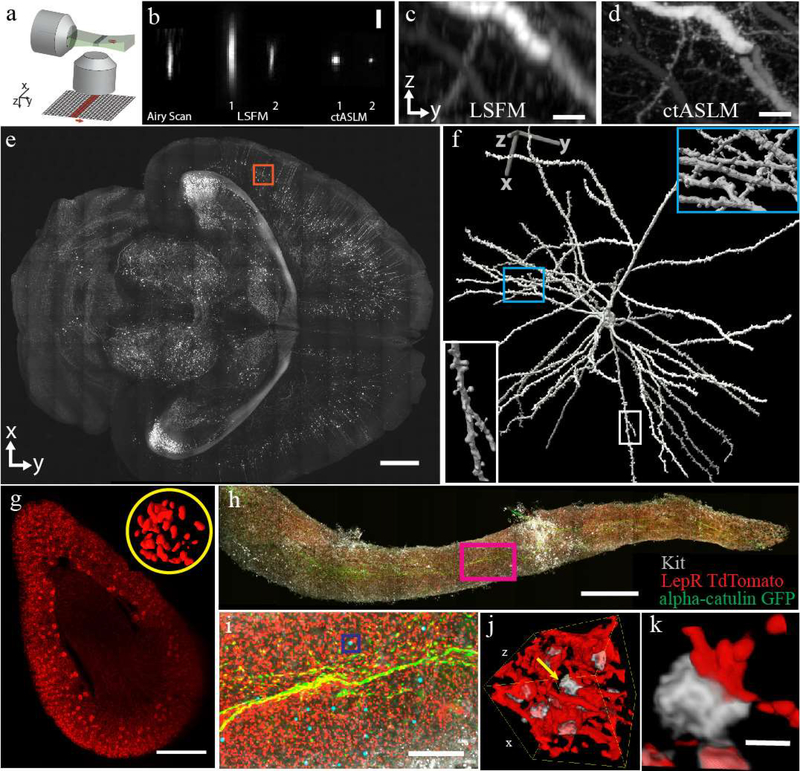
Figure 1 -. ctASLM enables isotropic, sub-micron imaging over large field of views.
(a) Working principle of axially swept light-sheet microscopy: a thin light-sheet is scanned in its propagation direction. The rolling shutter readout of an sCMOS camera, adjusted to the size of the beam waist, is tightly synchronized to the light sheet scan. (b) Experimentally measured PSF of Airy scan confocal microscopy, conventional light-sheet fluorescence microscopy (LSFM), and ctASLM. LSFM and ctASLM PSFs are shown for NA 0.4 (indicated with “1”) and 0.7 objectives (indicated with “2”). (c-d) Maximum intensity projections of CLARITY cleared cortical Thy1-eYFP neurons as imaged by LSFM and ctASLM, respectively. (e) An XY view of a section 2.5mm from the top surface of a Thy1-eGFP PEGASOS cleared brain. (f) Zoom-in of the red box with a rendered neuron. Insets provide magnified views of synaptic spines. (g) Volume rendering of a mouse kidney labeled with Flk1-GFP. Inset shows a 3D rendering of endothelial cells in one selected glomerulus. (h) Maximum intensity projection of a mouse tibia bone marrow plug. (i) Zoom-in of magenta box shows alpha-catulin-GFP+ cells (green, Alexa Fluor 488), Lepr+ niche cells (red, tdTomato) and cKit+ cells (grey, Alexa Fluor 647). Alpha-catulin-GFP+/cKit+ hematopoietic stem cells (HSC) are labeled with cyan spheres. (j&k) are the volume-rendering of boxed region in (h), showing progenitor cells in grey and niche cells in red. All biological data acquired with NA 0.4 objectives. Scale bars are: (b) 3 μm, (c,d) 20 μm, (e) 1 mm, (g) 500 μm, (h) 1 mm, (i) 200 μm, (j) 40×40×40 μm3, (k) 5 μm.

