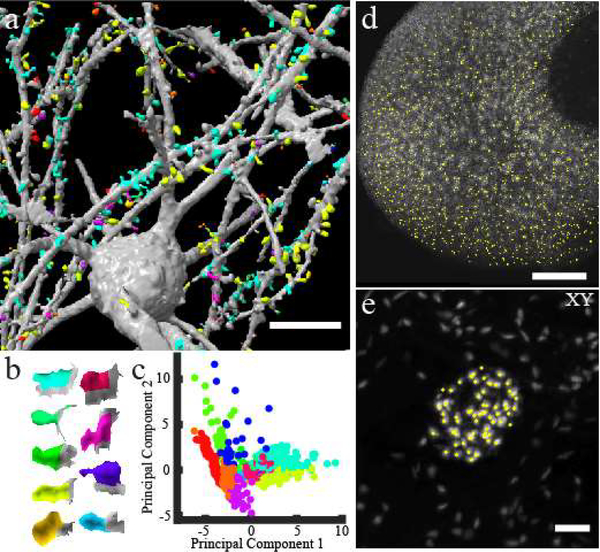
Figure 2 -. ctASLM allows detection of cellular and subcellular features in large tissues.
(a) Machine learning based supervised detection and unsupervised clustering of spines in a Clarity cleared mouse brain. (b) The shape of the median spine in each cluster. (c) Principal component analysis of the spines. (d) automatic detection of glomeruli in the mouse kidney data set shown in Fig 2 (e). (e) Lateral maximum intensity projection of one glomerulus and detection of individual endothelial cells (yellow circles). Data acquired with NA 0.4 objectives. Scale bar: (a) 20 μm, (d) 200 μm, (e) 50 μm

