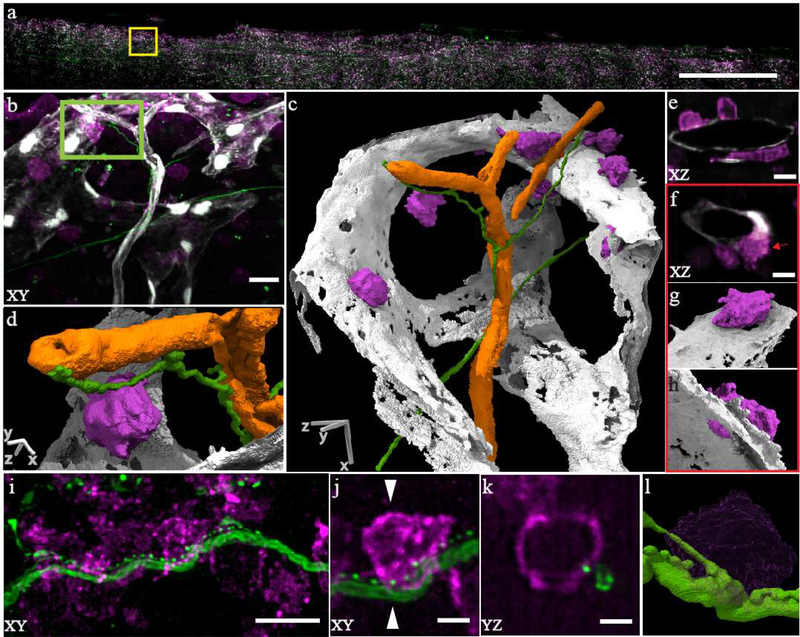
Figure 3 -. ctASLM allows visualization of subcellular interactions amongst cells in large tissues.
(a) Maximum intensity projection of a mouse bone marrow specimen. (b) Zoom-in of yellow box shows c-kit+ stem/progenitor cells (magenta, Alexa 647), nerve fibers (green, Alexa 488) and blood-vessels (gray, tdTomato). (c) 3D segmented and rendered view of (b). Orange depicts arterioles. (d) Zoomed in view (segmented & rendered) view of the green box in (b) showing c-kit+ cells in contact with a nerve fiber. (e) XZ cross-section of cKit+ cells residing on the sinusoids. (f) c-kit+ cells are positioned along fenestrations in the walls of the sinusoids. (g&h) 3D rendering of cell highlighted in (f). (i) Nerve fibers with punctate staining adjacent to cKit+ positive cells. (j) Zoom in view shows a possible interaction. (k) YZ view along a plane indicated by white triangles in (j) showing an interaction between a nerve fiber and a c-kit+ cell. (l) Volume rendering of (j). Data acquired with NA 0.7 objectives. Scale bar: (a) 500 μm (b&c) 10 μm (d) 2.5 μm (e&f) 5 μm (i) 10 μm (j&k) 2.5 μm

