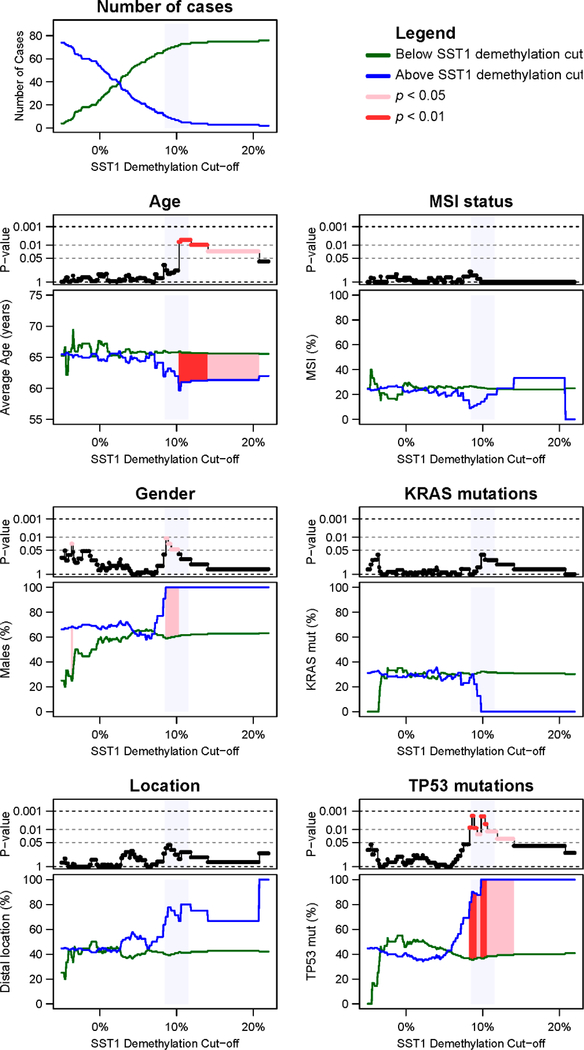
Figure 3.
SST1 methylation and clinicopathological features of CRC. CRC cases with quantitative information of SST1 somatic demethylation (n = 80) were classified into two groups, i.e., below (green lines) and above (blue lines) increasing SST1 demethylation cutoff values. We explored the effect of the different cutoffs between −5% and 22%, with a 0.1% increment. The information of every clinicopathological and mutational factor is represented in a stacked pair of graphs. The upper graph of every pair shows, in a negative logarithmic scale (y axis), the p value of the comparison between tumors below and tumors above the SST1 demethylation cutoff employed for the classification (x axis). In pink, p values < 0.05. In red, p values < 0.01. The lower graph of every pair shows the values of the parameters (y axis) for the group of tumors below (green) or above the cutoff (blue). The SST1 demethylation regions where the applied cutoff yielded statistical significance are also indicated in pink (p < 0.05) and red (p < 0.01). Age was compared by Student’s t test. Gender, KRAS mutations and TP53 mutations were analyzed by Fisher’s exact test. Shaded in light blue, the region around the 10% demethylation cutoff.

