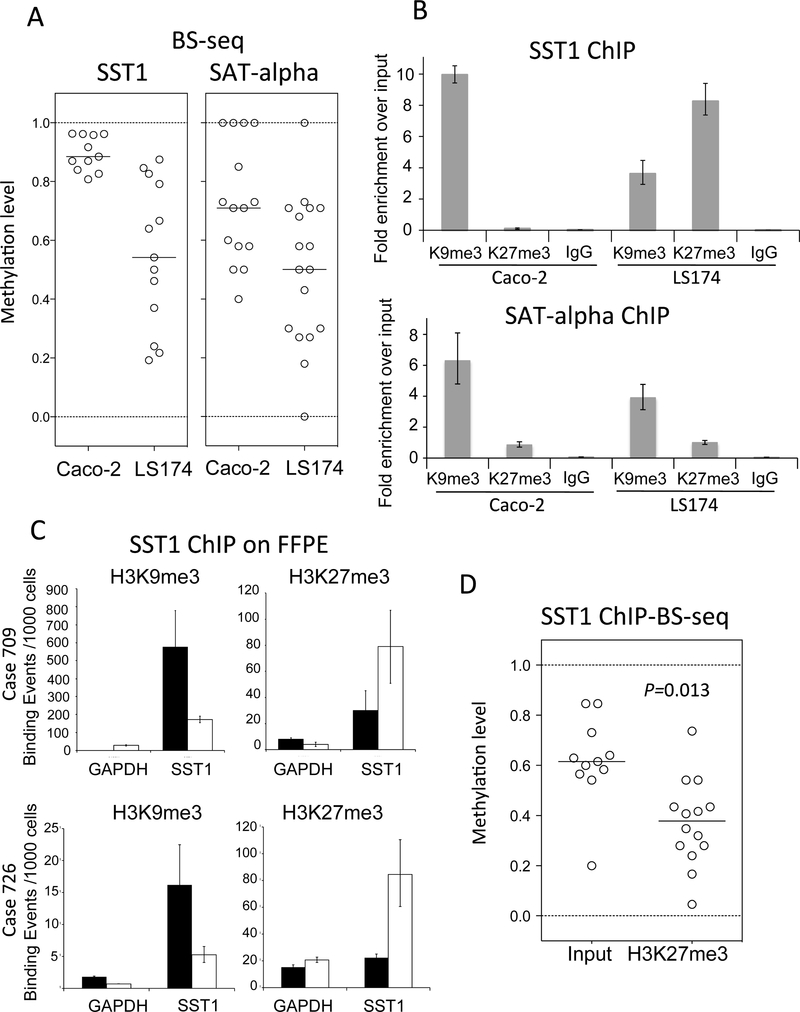
Figure 4.
SST1, but not SATα methylation, correlates positively with histone 3 lysine 9 trimethylation (H3K9me3) levels and negatively with histone 3 lysine 27 trimethylation (H3K27me3). (A) SST1 and SATα methylation levels of individual clones analyzed by bisufite sequencing in CIRC cell lines Caco-2 and LS174. As in Figure 1C, each dot corresponds to average methylation level present in one PCR clone sequence; (B) chromatin immunoprecipitation analysis (ChIP) of histone modifications on SST1 element. Demethylation of SST1 associates with increased H3K27me3 and reduction of H3K9me3 in SST1 chromatin. Demethylation of SATα element associates with decrease of H3K9me3 but not with H3K27me3 increase. Fold change was calculated relative to the input (comparative Ct method). IgG indicate immunoprecipitation background levels; (C) ChIP analysis of histone modifications associated with SST1 repetitive elements in two representative cases of colon cancer formalin-fixed paraffin-embedded (FFPE) primary tissue. Both tumors (709 and 726) displaying severe and moderate SST1 demethylation, respectively (Figure 1C), showed a shift from high levels of SST1 methylation and H3K9me3 enrichment in normal tissue (black bars) to SST1 demethylation accompanied with H3K9me3 reduction and H3K27me3 increase in the tumor (white bars); and (D) demethylated SST1 DNA associates with H3K27me3 by ChIP analysis in CRC cell line LS174T. The immunoprecipitated genomic DNA regions were bisulfite sequenced to monitor SST1 (ChIP-BS-seq). Input DNA: bisulfite treated input DNA purified after sonication. H3K27me3 DNA: bisulfite-treated DNA after H3K27me3 immunoprecipitation. SST1 elements associated with H3K27me3 show significantly higher demethylation compared to the input. p value was calculated by t test.

