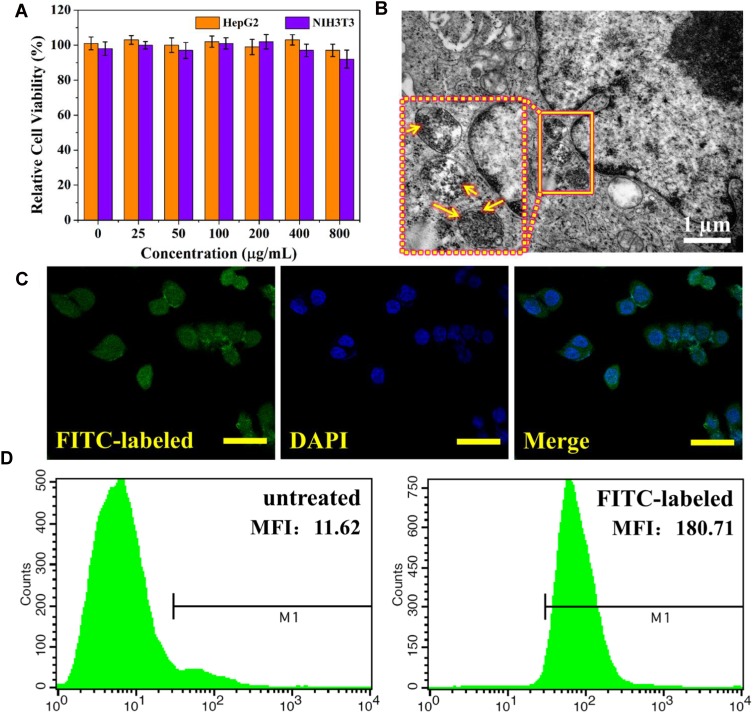
Figure 3.
In vitro cell experiments. (A) Relative cell viability by CCK-8 assay of HepG2 and NIH3T3 cells incubated with different concentrations of MPGds for 24 hrs. (B) Bio-TEM image of HepG2 cells incubated with MPGds at 200 μg/mL for 6 hrs (scale bar =1 μm) and the nanoparticles can be seen in the organelle from magnified image in dotted box (yellow arrows). (C) CLSM images of MPGds in vitro. FITC-labeled MPGds (green) in the cytoplasm, cell nuclei (stained by DAPI, blue) and merged image. Scale bar: 50 μm. (D) Representative flow cytometric analysis of HepG2 cells before and after incubation with FITC-labelled MPGds at 200 μg/mL for 6 hrs. The mean fluorescence intensity (MFI) values was listed: 11.62 for control and 180.71 for FITC-labeled MPGds.

