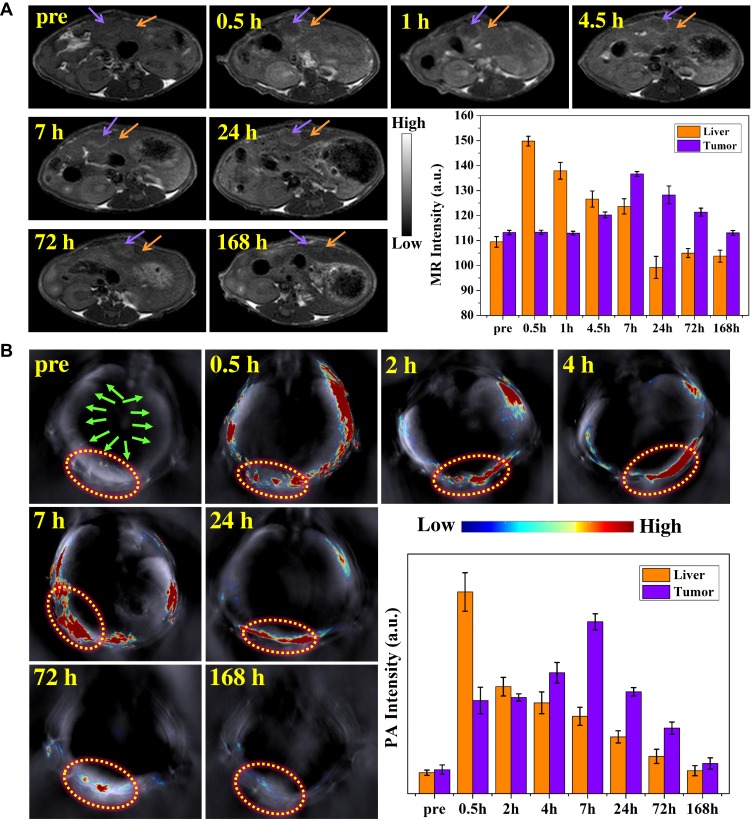
Figure 5.
In vivo MR and PA imaging studies of MPGds. (A) T1-weighted MR axial images and the corresponding data analysis of MR measurements of tumor-bearing mice before (pre) and at various time points (0.5 hr, 1 hr, 4.5 hrs, 7 hrs, 24 hrs, 72 hrs and 168 hrs) after injection of MPGds using 3.0 T clinical MRI equipment. The purple arrows point the tumor sites and the orange arrows point the liver. (B) PA images and the corresponding PA signal intensities in the tumor region collected by the MOST imaging system before (pre) and at various time points (0.5 hr, 2 hrs, 4 hrs, 7 hrs, 24 hrs, 72 hrs, and 168 hrs) after injection of MPGds. The green arrows point the liver and the yellow circles point the orthotopic tumor sites. Error bars mean standard deviations (n = 4).

