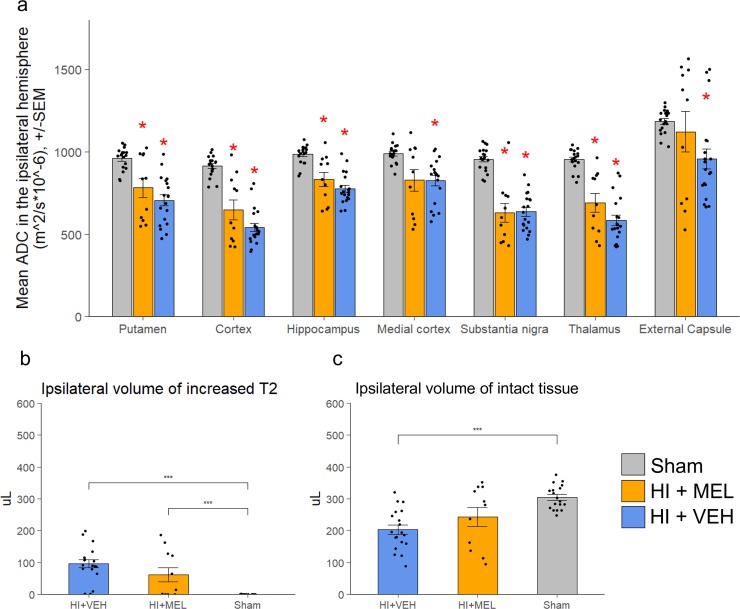
Fig 2. MRI metrics 1 day after HI.
ADC and T2-weighted images were acquired one day after HI. a: ADC values were measured in different areas in the ipsilateral hemisphere and compared between treatment groups. *: Significantly different from sham (p < 0.05). b and c: T2-weighted images were used to measure b) ipsilateral volume of increased signal and c) ipsilateral volume of normointense tissue (***: p < 0.001. *: p < 0.05). Error bars represent SEM.

