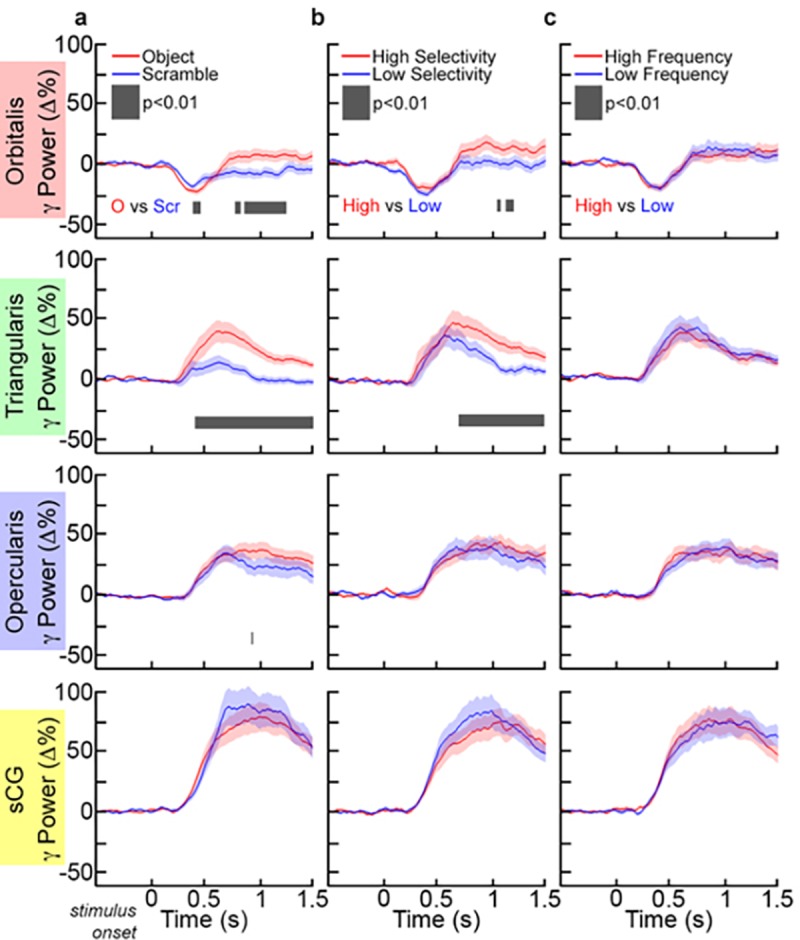
Fig 5. Grouped gamma activation in IFG and sCG during each condition.

Across subjects, gamma (70–110 Hz) power changes were averaged (mean±1SD) in each sub-region for (a) both tasks (object and scrambled naming). Comparisons between tasks and conditions were computed at each time-point (p<0.01, paired t-test, two-sided, FDR corrected). (b) In the comparison of high- or low-selectivity objects, only PTr showed a sustained difference in activation (black bar). However, (c) for high- or low-frequency objects, no regions showed a significant difference in activation.
